Introduction
NEMO is an All-In-One product for VoIP Services and Networks, covering the following functions:
- Monitoring
- Reporting
- Troubleshooting
- Alarming
- Debugging
- Fraud detection
NEMO is a vendor agnostic monitoring and reporting platform, designed to reflect the usage of a VoIP network by gathering data using probes and CDRs, irrespective of format.
Following Netaxis Solutions' product philosophy, NEMO has been thought and designed from day one for flexibility and easiness to operate. Indeed, NEMO can be deployed in many different ways thanks to the range of probes developed by Netaxis: from the portable probe (not bigger than a book, can be easily moved from one place to another) to the Probe L which can cope with thousands of simultaneous calls.
In case probes are complicated to be deployed, NEMO can rely on CDRs produced by network equipment to provide valuable network indicators. NEMO can also work in hybrid mode (Probes and CDRs) when needed.
Flexible Reporting
The reporting aspect of NEMO is particularly strong, allowing network operators to flexibly "slice and dice" information for resellers and end-users in many ways: by reseller, customer, site, individual end-user etc. This flexibility, combined with the fact that NEMO is natively multi-tenant and comes with fine-grained user profile definition, gives the possibility to make the NEMO portal accessible to different types of users: from very technically skilled engineers for troubleshooting, to customers for end-user reporting only.
Troubleshooting features
The gathering of SIP/RTP data using probes allows NEMO to troubleshoot problems with calls, by providing end-to-end call flows, SIP message details, media stream analysis and media replay possibility. Netaxis Solutions' probes are not passive probes that only sniff the network traffic: they are also capable to generate programmable traffic patterns that will be monitored by NEMO.
NEMO Basic Notions
This User Guide is designed to assist NEMO users and administrators in managing all the features NEMO offers:
- plotting graphs with statistical results,
- listing and searching calls and traces,
- inspecting traffic anomalies and SNMP traces,
- and selecting and exporting reports.
NEMO Terminology
NEMO framework (and documentation) uses a terminology with some rather specific meanings. It is important that the user has a clear understanding of this terminology.
Network elements
Network elements in NEMO are essentially the CDR sources. Other data applications interfacing with NEMO through a Rest API to extract statistics are preferably called third party equipment (see below).
Entities
An entity is a physical or logical element of the telecommunication network under monitoring by NEMO. In a broader meaning, entity can also designate any element under monitoring in the network, or accessing the network (like third party equipment).
WARNING
In some locations in the interface and in this document, the logical entities of the devices are called 'objects', e.g. in the Settings > User > Access Privileges tab.
Third-party equipments
In NEMO terminology, a third party equipment is an equipment external to the telecom network under monitoring. This equipment accesses NEMO Stats DB through a rest API in order to collect statistics of interest.
Devices
NEMO devices are the names assigned to the physical entities covered by the deployment: in a multi-plugin mode deployment, devices would be, for example:
- Nemo Capture (probes), made of Probes (physical entity) and Trunks (logical entities)
- Net-Net SD (commercial name for Oracle SBC, CDR-emitting network element), made of Session Border Controller(s) (physical entities) and Realms, Endpoints, Source and Destinations ranges, all logical entities of the SBCs
- Broadworks, Cisco CDR-emitting network element, made of Application Servers (physical entities) and Service Providers or Groups[^1] (logical entities).
- Audiocodes, etc.
Plugins
NEMO plugins are the software components responsible for adapting the behavior of NEMO with respect to the monitored network element. While some equipments may provide detailed information about RTP, others may provide only information about SIP. In this case, only some of the functionality would be available. These equipments are built around different concepts and contexts (e.g. realms, enterprises, trunks, ...) for which NEMO adapts its level of aggregation for statistics. Refer to the chapter [Plugins Features List] for a detailed list of the features supported by each plugin.
Collectors
NEMO collectors are the software components responsible for collecting CDR data from monitored network equipments. They work hand-in-hand with plugins to ingest data and insert them into the DB. The protocols supported by the collectors depend on each type of plugin, as different network equipments use different protocols for CDR sending (e.g. Radius, SFTP, ...) as well as different formats (e.g. CSV, XML, ...).
Groups
Widely used in NEMO GUI, a group is a selection made of one or more entities (aka « groups » or « configuration objects ») belonging to the devices that are part of the deployment, and possibly also including label(s) (see above). A group selection of 7 groups belonging to 3 different devices is legitimate ; a group selection of one group, however self-contradictory in the common language, is legitimate as well.
You can « promote » a selection of groups to a permanent status by creating a label for it (see next section).
Group is the first field to fill in in any browser page of Call Statistics, Voice Quality and Anomalies modules. The field presents a drop-down list with all groups / configuration objects or entities available for each device part of the deployment. Labels are also listed and can be part of any group selection.
Groups for which some criteria are not present (for example, QoS in Broadworks groups) are simply ignored in the resulting display (see Modal Behavior below).
The selection made for Group (possibly a single group) in any browser page of Call Statistics or Voice Quality modules is kept active in any other browser page of these modules until modified by the user. Anomalies' browser page always opens 'clean', with no prior selection kept for Group.
Labels
In NEMO terminology, labels are permanent, user-defined logical groups of entities. Several labels can be assigned to the same entity. For instance, a label can be created to tag all realms or all trunks belonging to small and medium enterprises, and another label can be created to tag all realms or all trunks with a specific IP access network. Labels can later be used to produce reports for groupings of entities.
Note that in some occasions, label can also be used in its usual meaning. Nemo Capture or Net-Net SD are labels used in the GUI to designate the physical and logical entities of the Probes (Probes and Trunks) or of the Oracle SBCs (Realms, Endpoints, Ranges...).
Nodes
Node is used to designate a hardware equipment part of the telecom network being monitored, typically a server. Note however that a node can also be virtual if the network has been designed with virtual machines.
Contexts
Not used in this document. A context is a selection of multiple groups belonging or not to the same device: a group of groups. The term "Groups" is the one used in the graphical interface.
Logical Architecture
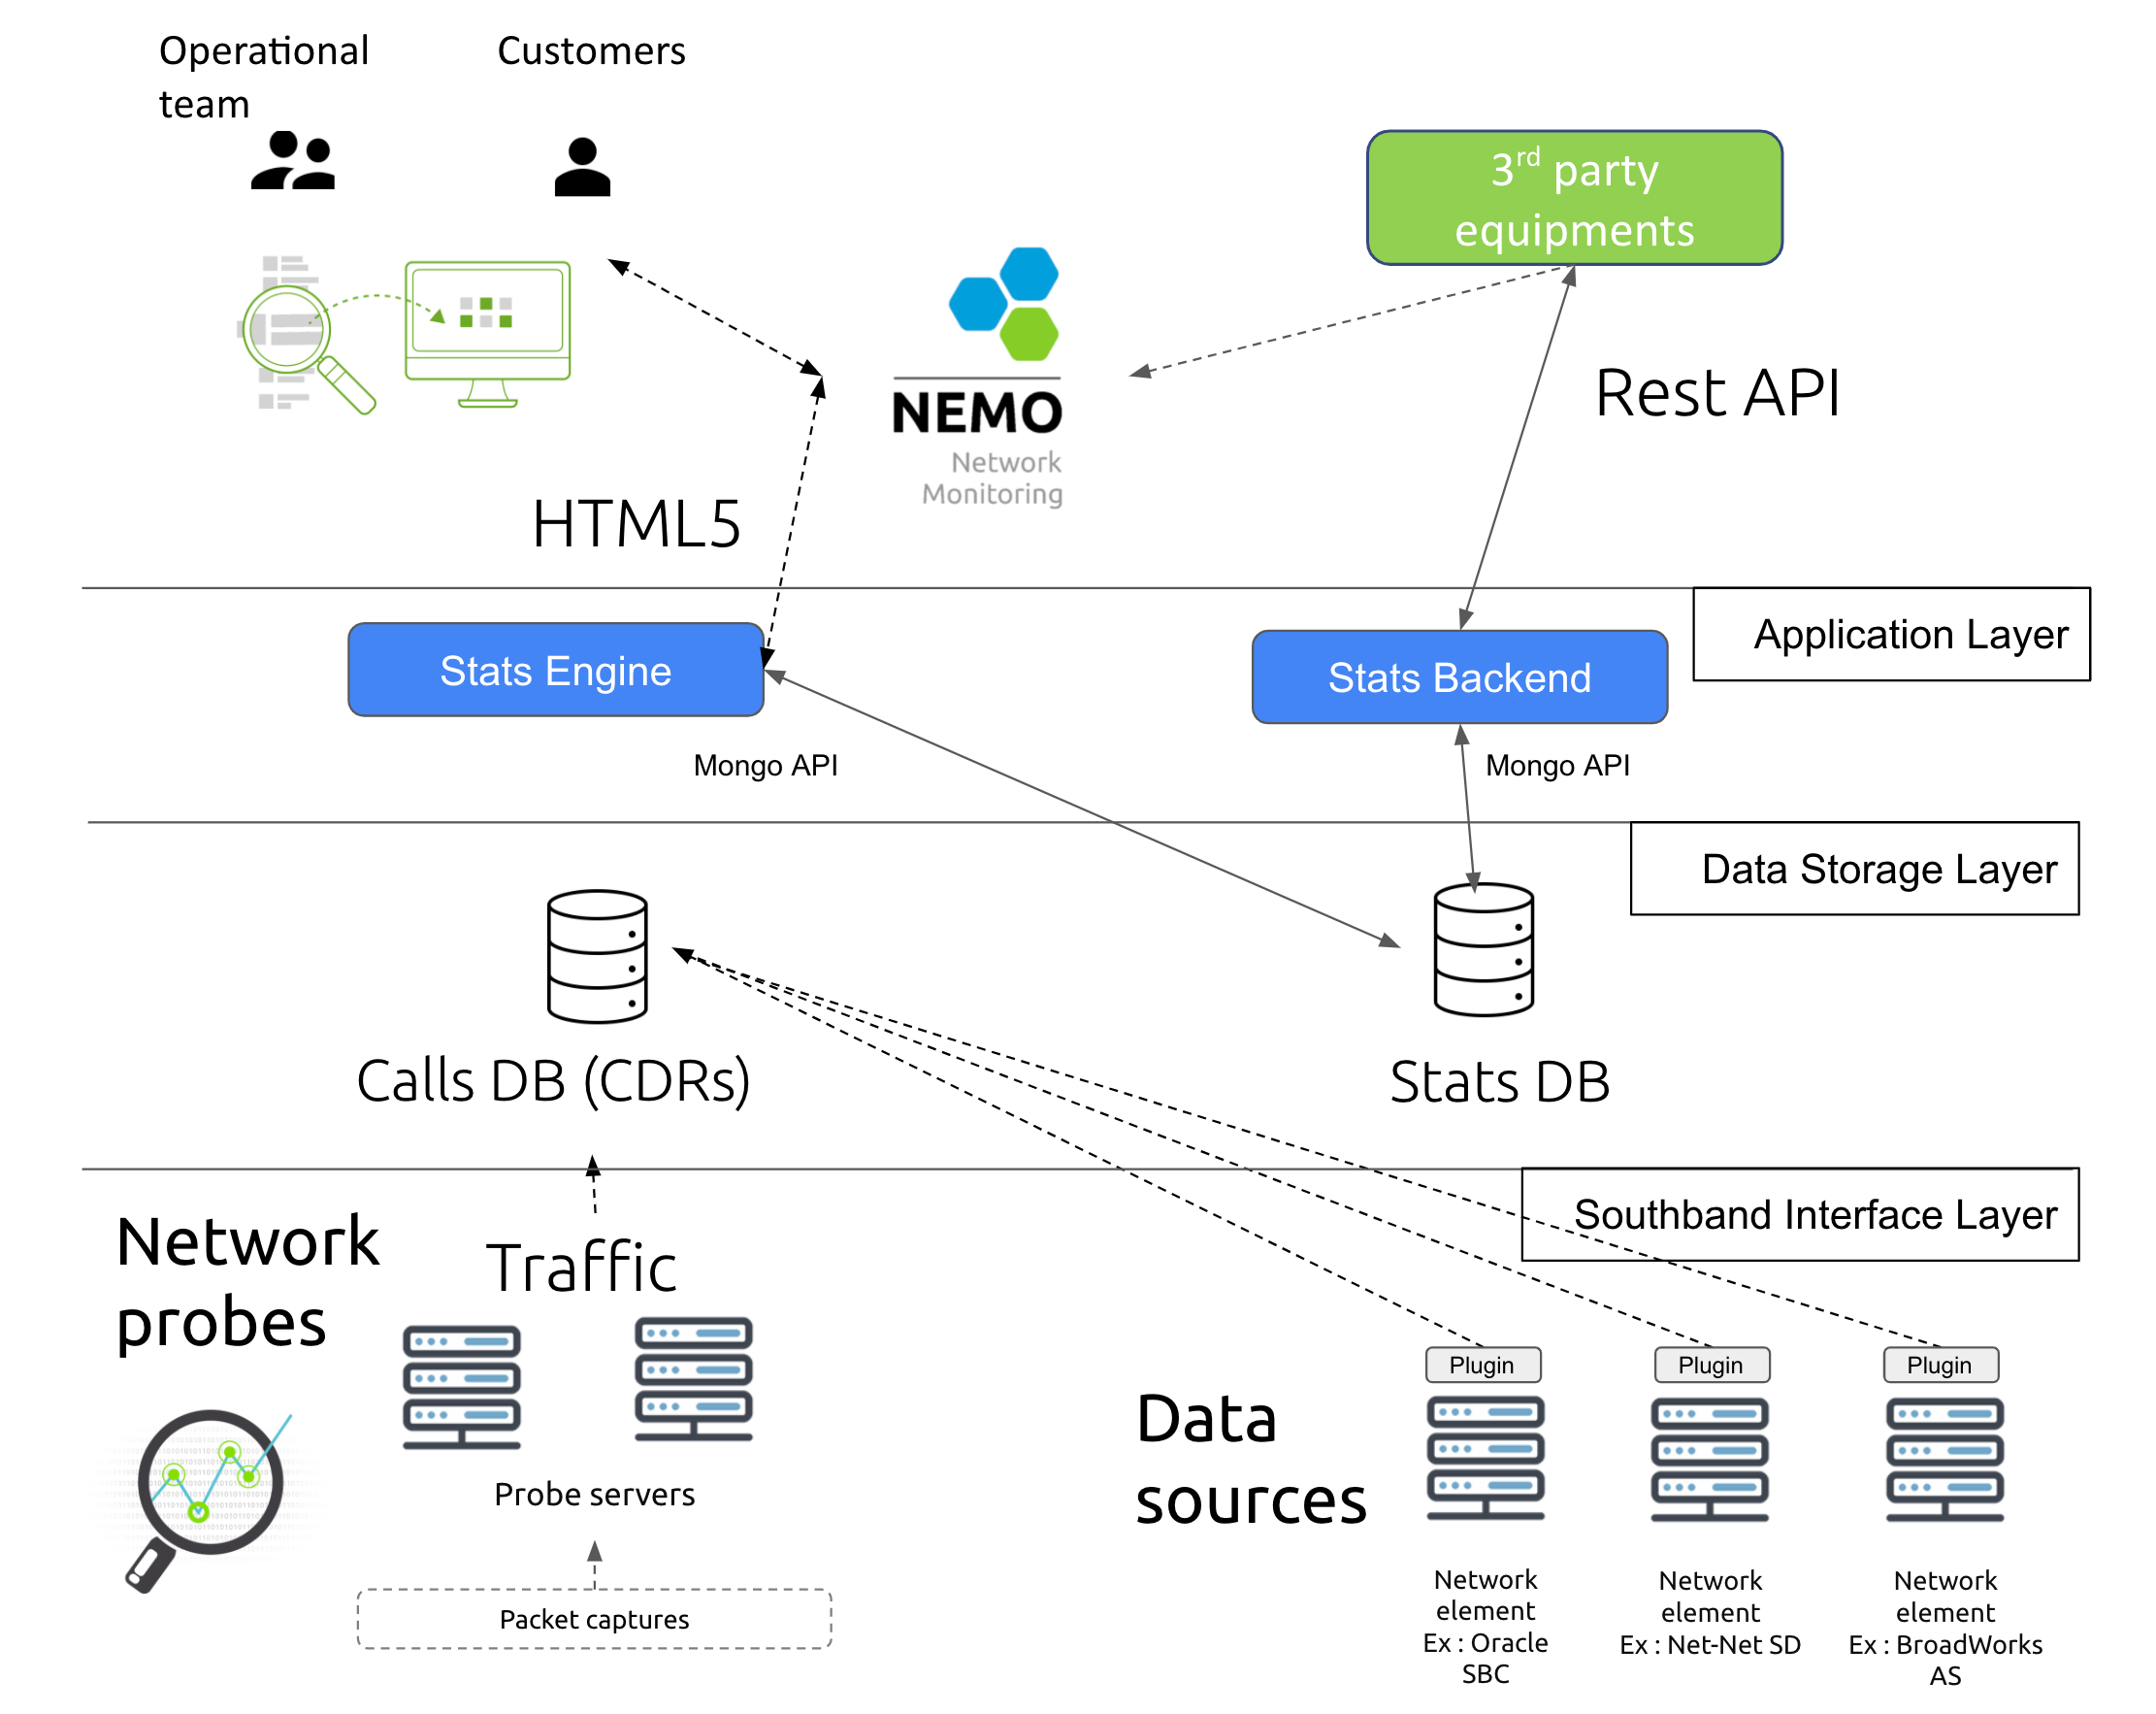
NEMO logical architecture is a three-layer one: Interface Layer, Data Storage Layer and Application Layer.
NEMO has been designed to be modular: all these logical layers can either run on the same computing instance or be spread on different computing instances.
One NEMO instance can handle several CDR sources together (SBC, Broadworks, Probes...) in multi-plugin mode (see NEMO 4.1 User Guide below).
Modules
The following list enumerates the modules NEMO is based upon and provides for each module the list of related commands.
Each module and each of its items are described in full details in the section 00_nemo4_User_Guide_book.xml#features (from a logical viewpoint) and the section 00_nemo4_User_Guide_book.xml#modules.
Call Statistics Module
- Sessions
- Registrations
- Call Durations
- Call Destinations & Sources
- Release Causes
Voice Quality Module
- Packet Loss
- Packet Jitter
- Packet Latency
- MOS
- Codecs
- Media Bandwidth
Calls Module
- Search Calls
- Search Traces
- Trace Analysis
Anomalies Module
- Anomalies Browser
- SNMP Alarms
Reporting Module
- Service Provider Reports
- Third-party Reports
- Customer Reports
- Statistics Exports
- CDR Exports
Settings Module
The extensive set of configuration settings allows the Administrator user to tailor NEMO to the needs and environment.
- Users
- Nemo Capture (if probes)
- Plugin(s) For example, depending on actual deployment:
- Net-Net SD (plugin for Oracle SBC)
- Broadworks (plugin for Cisco SBC)
- Labels
- Reports
- Statistics Exports
- CDR Exports
- Anomalies
- SNMP
- Tracing
- Metrics
- System
- Logs
Modularity
NEMO is natively modular: all logical layers can either run on the same physical entity or be spread on different physical entities. NEMO also presents a multi-tenant architecture, with possibility to create dashboards & reports that can be exposed to internal/external customers.
Modal Behavior
NEMO can monitor environments in four different modes, depending on how the solution has been deployed (a.o. on which plugins are installed):
- CDR mode with CDR-emitting equipment, or
- probe mode with call data capturing probes,
- with both: hybrid mode,
- with probes and more than one CDR-emitting device: multi-plugin mode.
Each mode collects, stores and processes different data, which will produce monitoring statistics accessible through graphs, lists and reports.
For more details about which output may be expected with each mode, please refer to the table below:
| Module | CDR mode | Probe mode | Hybrid mode | Multi-plugin mode |
|---|---|---|---|---|
| Call Statistics Module | ||||
| Sessions | YES | YES | YES | YES |
| Registrations | YES* | YES | YES* | YES* |
| Call Durations | YES | YES | YES | YES |
| Call Destinations & Sources | YES | YES | YES | YES |
| Release Causes | YES | YES | YES | YES |
| Voice Quality Module | ||||
| Packet Loss | YES** | YES | YES | YES** |
| Packet Jitter | YES** | YES | YES | YES** |
| Packet Latency | YES** | YES | YES | YES** |
| MOS | YES** | YES | YES | YES** |
| Codecs | YES** | YES | YES | YES** |
| Media Bandwidth | YES** | YES | YES | YES** |
| Calls Module | ||||
| Search Calls | YES*** | YES | YES | YES*** |
| Search Traces | NO | YES | YES | YES**** |
| Trace Analysis | YES | YES | YES | YES |
| Anomalies Module | ||||
| Anomalies Browser | YES | YES | YES | YES |
| Alarming (SNMP trap, mail, SMS) | YES | YES | YES | YES |
* Only if CDRs for registration are produced.
** Only if CDR contains media flow information.
*** Search calls is possible but:
- end-to-end call flow feature is not available
- SIP message content is not available
- RTP flows are not recorded.
**** If one of the plugins is Probes.
NEMO and GDPR
NEMO is a Network Monitoring tool which provides service providers and enterprises with insights in their VoIP traffic as well as the capability to monitor the quality of their network and, in case of issues, to trace down the root cause.
To achieve this, NEMO analyzes IP traffic and/or CDRs (call detail records). Consequently, this data contains personal data like phone numbers of calling and called users, as well as potentially media content related to individual phone calls. The platform monitors the network in real time but also provides capabilities to do historical searches.
As a consequence, service providers and enterprises deploying and using NEMO act as data controller and/or processor in relation to all users that explicitly or implicitly make use of the VoIP network under observation.
As indicated in the GDPR (ref: recital 47 and 49), the processing of personal data for network information and security can be considered as a legitimate purpose. Of course, given the sensitive nature of the collected and processed data, special care has to be taken. NEMO provides a set of features and capabilities which help the service provider or enterprise to use NEMO without breaching their obligations under the GDPR.
4 Key Principles
In terms of features, NEMO relies on 4 main principles :
Data minimization:
- Only collect data you really need
- Restrict data retention to what is needed to ensure your operations
- Anonymize for long term retention
Data protection:
- Protection of data at rest
- Protection of data in transit
Limit data exposure
- Ensure that only qualified people have access to the most sensitive data
Audit
- Monitor usage and detect abuses
Guidelines for Implementation
This section provides reference to descriptions of NEMO features in this User Guide in relation with the above principles.
Data Minimization
How to configure which traffic is monitored
Monitored traffic is defined by declaring Groups and Labels.
How to configure which RTP traffic is monitored
Monitored RTP traffic is defined by activating Tracing, see Tracing.
How to configure the CDRs retention time in the system:
Retention time for CDRS is configured by accessing Settings>System>HealthMonitor/Advanced options and adapting the value of max age of CDRs in days setting as desired.
How to configure the total amount of CDRs allowed in the database:
Total amount of CDRs allowed is configured by accessing Settings>System>HealthMonitor/Advanced options and adapting the value of max number of CDRs to keep in database setting as desired.
How to limit access to individual calls:
Access to all individual calls and traces can be blocked per user, see Edit an Existing User, Access Privileges>Modules or Groups or Reports, simply by revoking the corresponding privilege(s): Search Calls, Search Traces, Retrieve Media Streams, etc.
While NEMO collects CDRs or traces, the StatEngine sub-module computes the stats and stores them in DB, aggregated per trunk for reports, graphs, anomalies etc. Once CDRs are purged (see above: CDRs retention time), access to individual calls is not possible anymore (anonymisation) -- but aggregated statistical data remain accessible.
Data Protection
The protection of data collected by NEMO is determined by the network topology and security rules enforced by service providers and enterprises. Usually, NEMO GUI is located in a DMZ, while the DB server is located in a secured zone (« core » or the like), with a firewall between the DMZ and the core zone, preventing access to the data stored in DB.
Limit Data Exposure
NEMO provides two mechanisms allowing NEMO users acting as Data Controllers and Data Processors in the GDPR framework to activate the following:
Individual (per user) granting / revoking of Access Privileges to actions related with or subject to GDPR, through the Settings>Users>Edit Users>Access Privileges page where such privileges can be configured.
Recording individual user authorized accesses (or attempted and rejected ones) as well as individual actions belonging to the list Actions Logged below, through the logging feature using the
audit.logfile located on NEMO server at/var/log/nemo/audit.log(accessible through Settings>Logs - audit.log - View).
Audit
DANGER
Note the following information with regard to the logging of individual user access and of their actions into the audit.log file present in the system (see above).
The
audit.logfile rotates every day for a non-configurable duration of 100 days.The file located on NEMO server remains editable by system operators or administrators.
It is the customer responsibility to enforce their own security rules by limiting group access rights to this file and by ensuring it is timely backed up to an external and secure system.
Actions Logged
The following list enumerates the monitoring actions that are logged to the audit.log file.
- activation of new tracing
- removal of tracing
- trace download of call
- search calls
- search traces
- export calls
- live calls
- live traces
- open details of live trace
- open details of trace
- open details of call
- retrieval of media stream
Logging Syntax
- Granted / Blocked Authorization logging (based on Access Privileges):
ACCEPTED username: %s, name: %s, module: %s, request: %s
FORBIDDEN username: %s, name: %s, module: %s, request: %s- Actions logging:
ACTION username: %s, name: %s, request: %s, action: %s
ACTION retrieval of media stream %s
Examples
The following examples are extracted from an operational audit.log:
2019-07-02 09:25:53,646-40278-INFO-[] ACCEPTED username: admin, name: Administrator, module: dashboard, request: POST /dashboard/jsonDataPanels?refreshId=1562052353638 HTTP/1.1
2019-07-02 09:38:46,720-40278-INFO-[] FORBIDDEN username: admin, name: Administrator, module: dashboard, request: GET /dashboard/jsonDataDashboard HTTP/1.1
2019-07-02 09:42:47,873-40278-INFO-[] ACCEPTED username: admin, name: Administrator, module: calls->searchCalls, request: GET /calls/searchCalls HTTP/1.1
2019-07-02 09:45:23,684-40278-INFO-[] ACTION username: admin, name: Administrator, request: GET /calls/htmlDataCallDetails?cid=sonus-5d14c8f9fcdc7b176f783a24 HTTP/1.1, action: details of call id 5d14c8f9fcdc7b176f783a24 on device type sonus (calling=32000000001 called=32000000002 time=2019-06-27 14:09)
2019-07-02 09:43:49,389-40278-INFO-[] ACTION username: admin, name: Administrator, request: POST /settings/editTracing?action=createTracing HTTP/1.1, action: activation of new tracing (details={'rtpStats': False, 'description': u'trace name', 'rtpCapture': False, 'methods': [''], 'calling': u'', 'src_ip': u'', 'trace_reason_extra': u'', 'dst_ip': u'', '_id': ObjectId('5d1b0b35fcdc7b9d56f36df0'), 'called': u'', 'trace_reason': u'Customer Complaint'})
2019-07-02 09:44:43,034-40278-INFO-[] ACTION username: admin, name: Administrator, request: GET /settings/editTracing?action=removeTracing&tracingId=5d1b0b35fcdc7b9d56f36df0 HTTP/1.1, action: removal of tracing 5d1b0b35fcdc7b9d56f36df0
Further Customer Guidance
Netaxis Solutions Support team can provide NEMO Administrators with appropriate guidance on how to ensure smooth network operations while remaining GDPR compliant.
NEMO Features
The NEMO interface is a web-based Graphical User Interface (GUI). It can be accessed with any modern browser supporting the HTML5 standard.
Login Page
Once connected with a Web browser to the GUI of NEMO, the first step for the user is to authenticate and get access to the application using a combination of user name and password. Please refer to [Users] to learn how to create, modify and remove users.
Main Interface
Once the user has got access, the browser displays the main interface, as shown below.
At the top right, the name of the user is displayed with the status flag. The status flag informs about the health of the system. The flag is only visible if "status" module has been assigned to the user profile (see [Users] for information about module assignment).

The Dashboard
At first launch, the main interface may be empty, depending on the user profile, or display a Dashboard (cloned from the profile used to create the current user profile (see [Create a User] for more details).
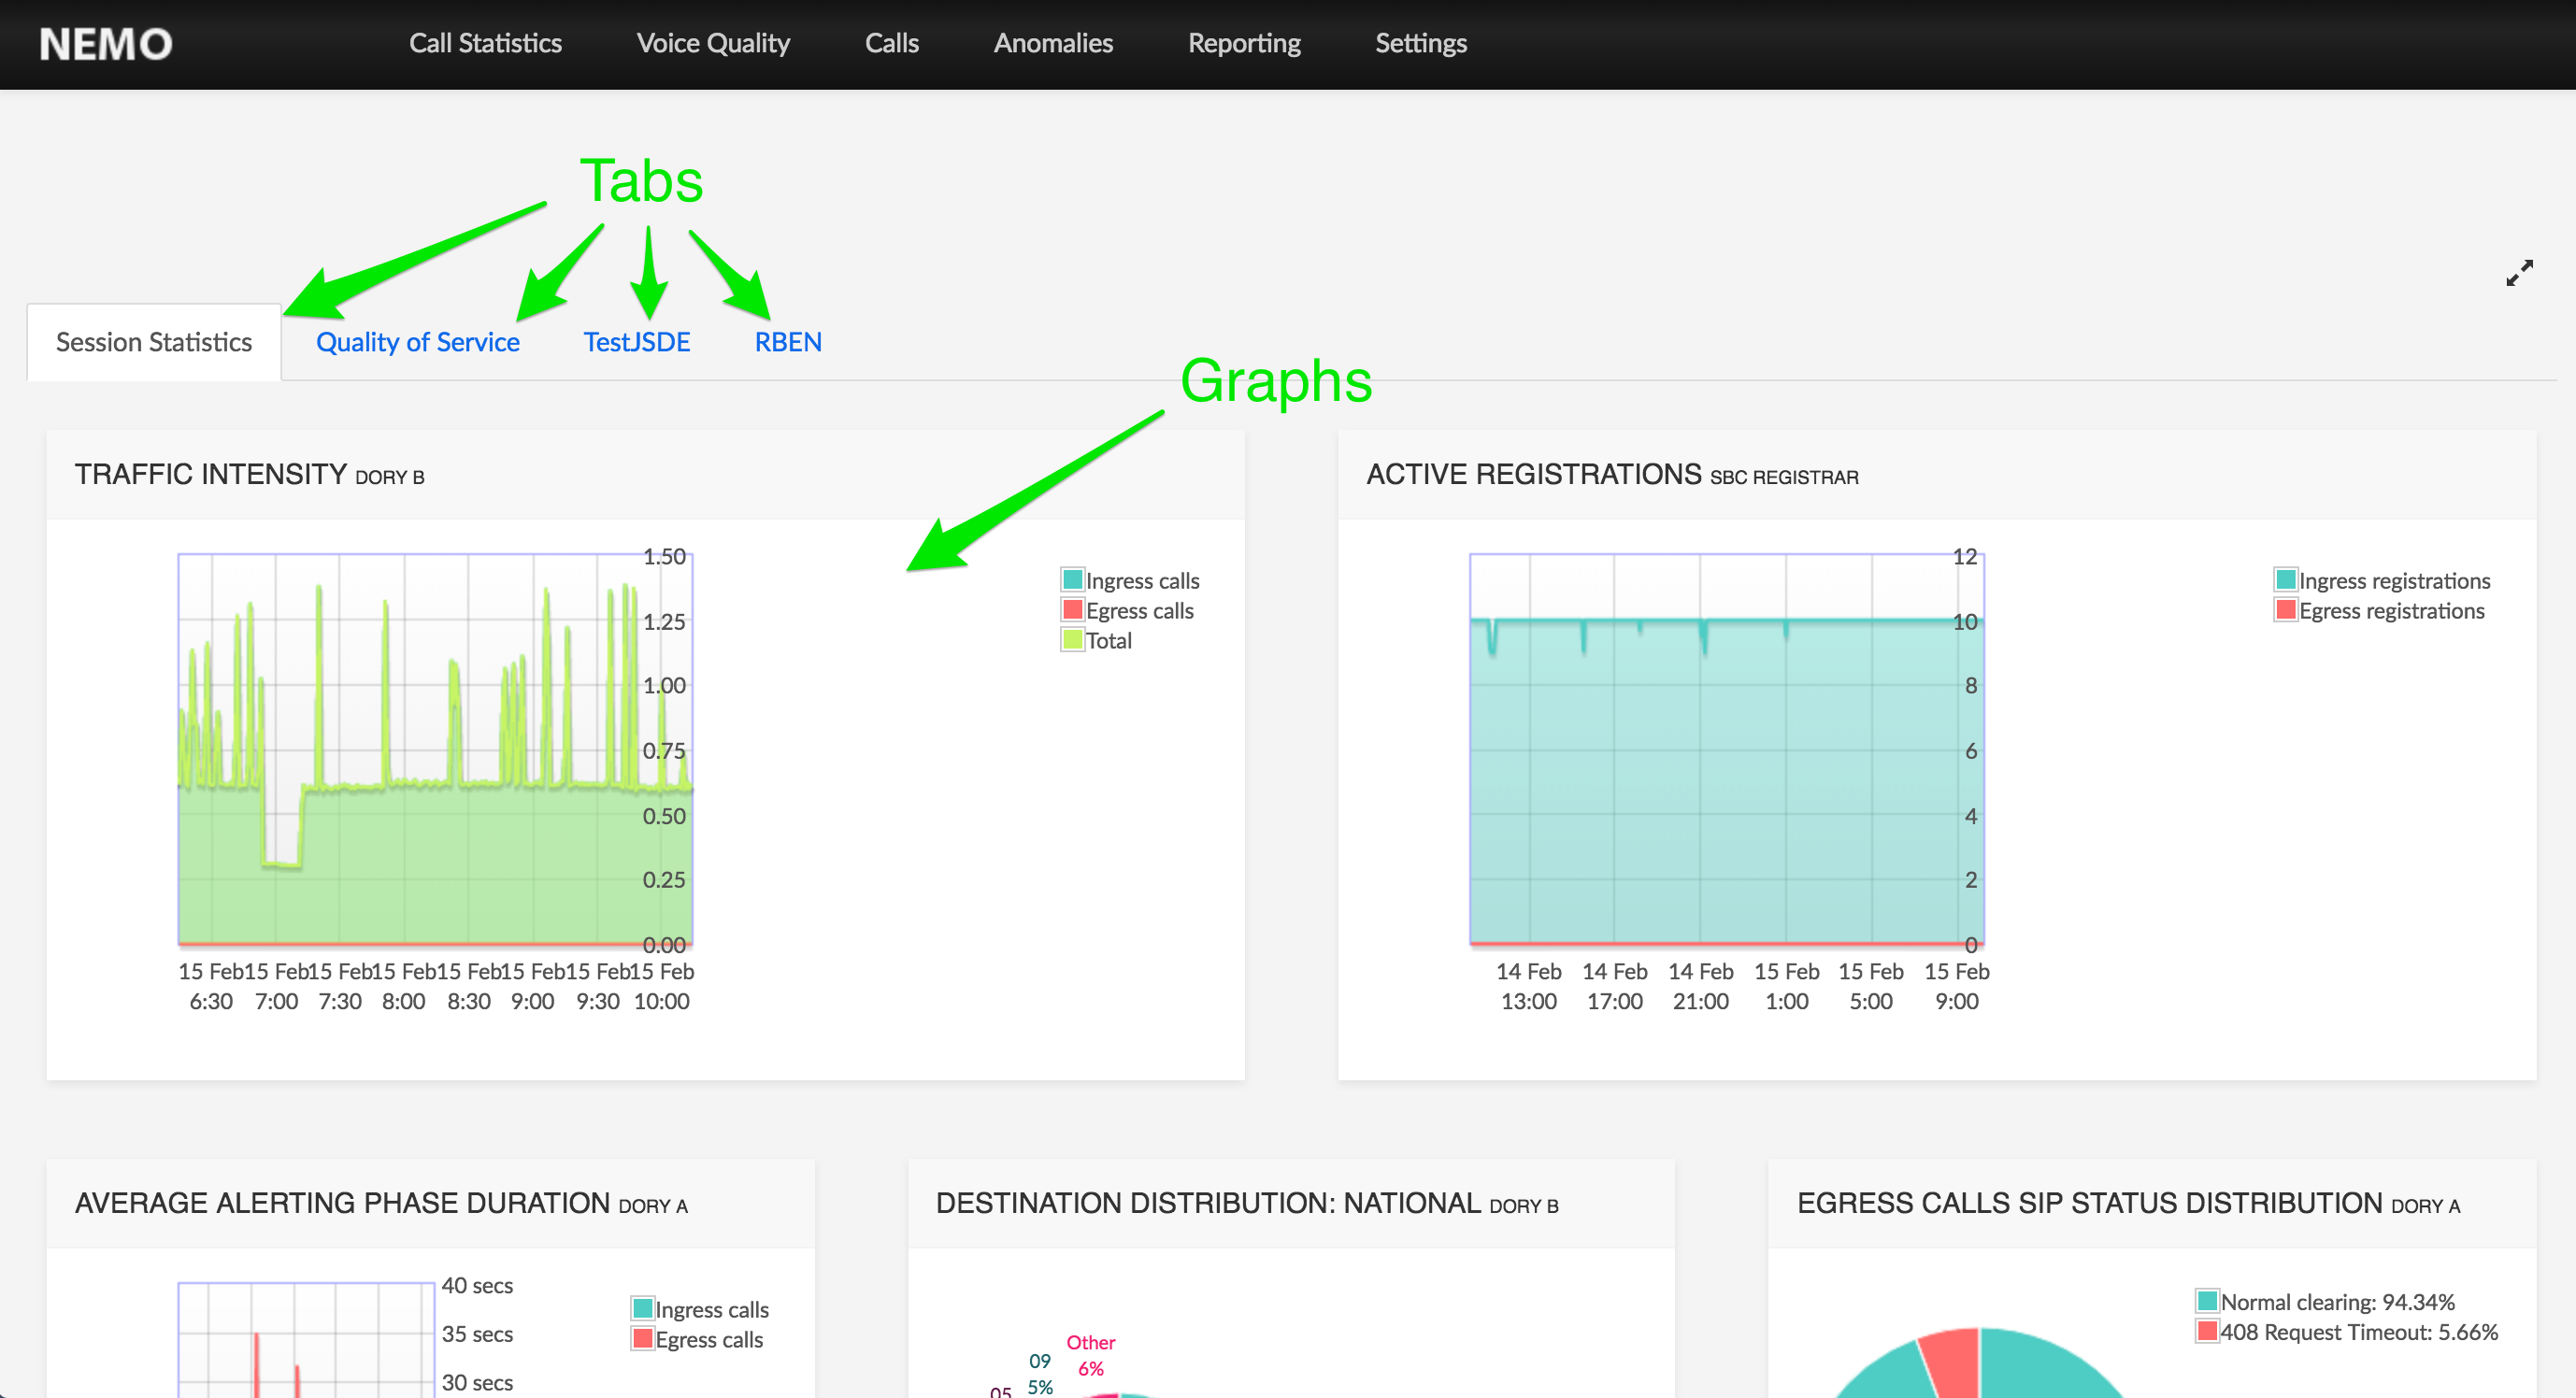
The picture below shows a Dashboard with its tabs and graphs.
If no Dashboard exists in the user profile, the Configure Dashboard button at the bottom of the screen allows creating one.
To create a Dashboard from scratch
Click the Configure Dashboard button.
In the New Tab screen, fill in a name for the dashboard first tab then click Create Tab.

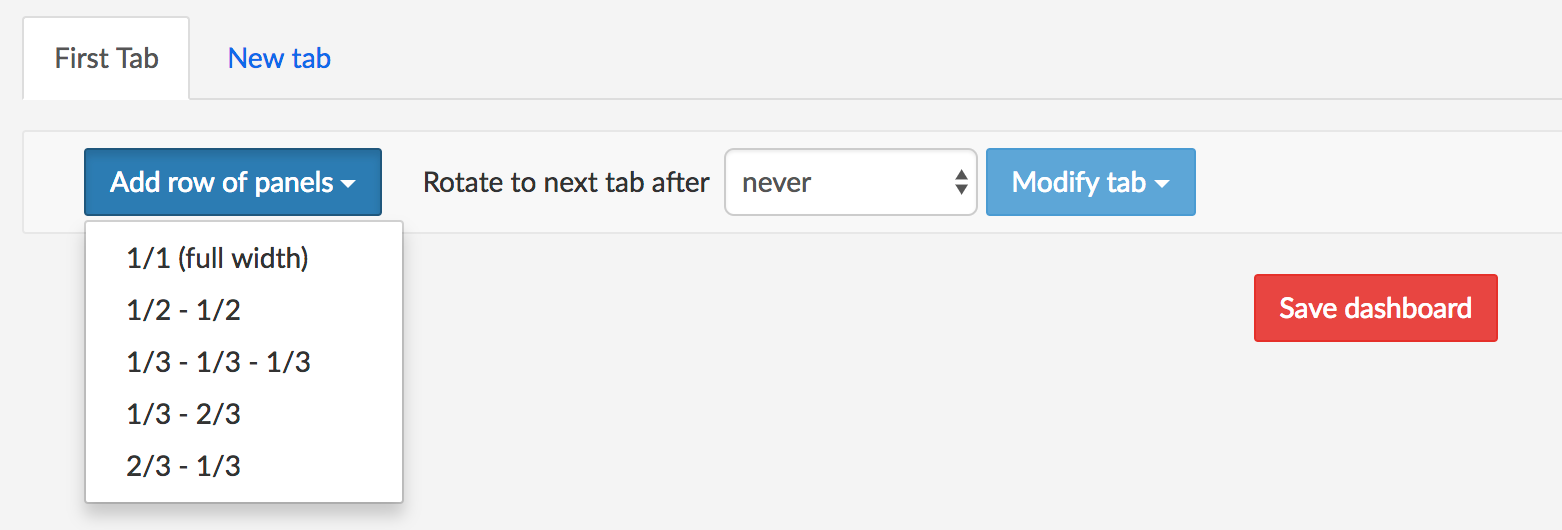
Using Add row of panels, select a layout (one graph in the tab or more).
Graphs are displayed in one or more panels on a row. Graphs can use the row's full width (one graph) or 1:2/1:2 (2 graphs on the row), 1:3/1:3/1:3 (3 graphs on the row), or 1:3/2:3 or 2:3/1:3 (2 graphs with different sizes).
In this example, a row with two panels 1:2/1:2 will be created.
With each Select Data, select a group, a statistic and a duration for the graph. If data are available, the resulting graph is shown on screen.
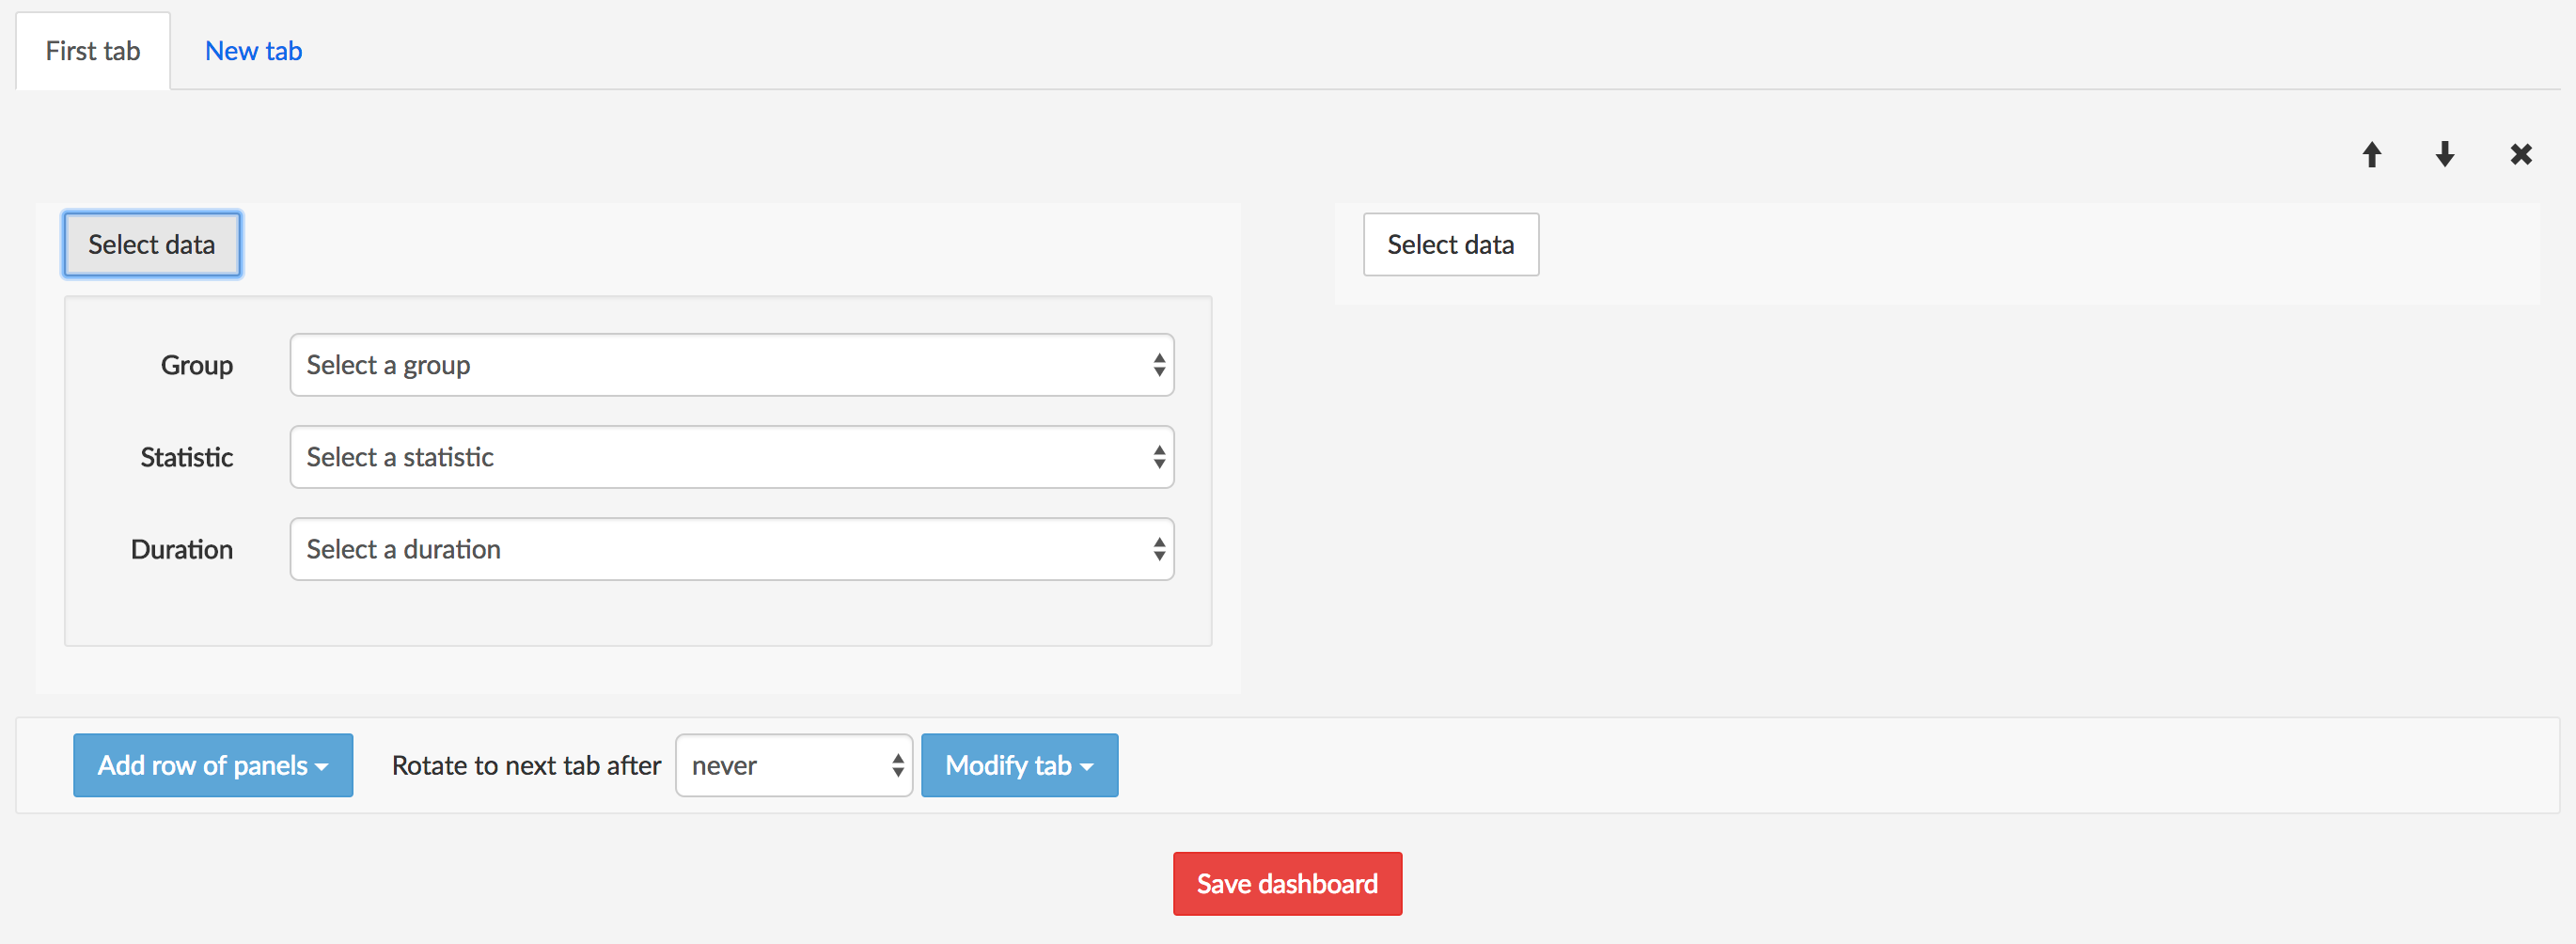
Select a rotation time for the tab (how long the tab is displayed before the Dashboard shows the next tab, if any).

Select a relative position for the tab (to the left, to the right --- when other tabs are present), or remove the tab.

If desired, add more rows to the tab the same way.
If desired, create more tabs the same way by clicking New tab.
Click Save Dashboard. This resumes the display of the main page with the selected graphs shown in the Dashboard zone.
The Main Menu Bar
The menu bar at the top provides access to the NEMO modules.

The interface is organized around six modules and their sub-menus. Depending on the user's access rights, not all six modules might be visible in the menu bar. Please refer to [Users] to learn how to set access privileges for the users.
The modules are divided in sub-menus. The complete menu hierarchy is as follows:
Call Statistics Module
- Sessions
- Registrations
- Call Durations
- Call Destinations & Sources
- Release Causes
Voice Quality Module
- Packet Loss
- Packet Jitter
- Packet Latency
- MOS
- Codecs
- Media Bandwidth
Calls Module
- Search Calls The 3 following sub-menus are present in Probes only mode, hybrid mode or multi-plugins mode.
- Search Traces
- Search Recordings
- Trace Analysis
Anomalies Module
- Anomalies Browser
- SNMP Alarms
Reporting Module
- Service Provider Reports
- Third-party Reports
- Customer Reports
- Statistics Exports
- CDR Exports
Settings Module
- Users
- Nemo Capture and/or NetNetSD and/or other label, depending on installed plugins and network elements
- Labels
- Reports
- Statistics Exports
- CDR Exports
- Anomalies
- SNMP
- Tracing (present in Probes only mode or hybrid mode)
- Metrics
- System
- Logs
Results Browsers (List Pages)
The Calls and Anomalies modules query the NEMO database to return data according to the criteria set in the Search tool. All these results lists share common elements, which allow filtering and browsing the results. These list pages are known, in NEMO terminology, as browsers.
The figure and table below describe these common elements.

| # | Name | Description |
|---|---|---|
| 1 | Show | Allows selecting the number of entries displayed per page (10 - 25 - 50 - 100) |
| 2 | Search | Allows specifying a chain of characters or digits to filter the results - refresh is immediate |
| 3 | Showing | Displays the scope of the current display and the total number of results for the query |
| 4 | Navigation | Allows navigating through the list from page to page |
| 5 | Button | Action button (depending on context) for further action on the list |
Data & Charts
The Call Statistics and Voice Quality modules allow the user to retrieve charts about metrics calculated by NEMO. They share a common data selection interface, described below.
INFO
The availability of the charts is user-based: not all users have access to all the charts. Access is defined in the user profile: for more details, see [Edit an Existing User].
Data Selection
The data selection interface allows the user to quickly retrieve a chart for a specific group selection (group, realm, trunk...) and a recent period.
This selection conveniently remains active as the user switches from the module where it was made first to another module. However, it may change according to specific actions like, for example, a Zoom in a chart: the value in Date Range is adapted to the range zoomed into.
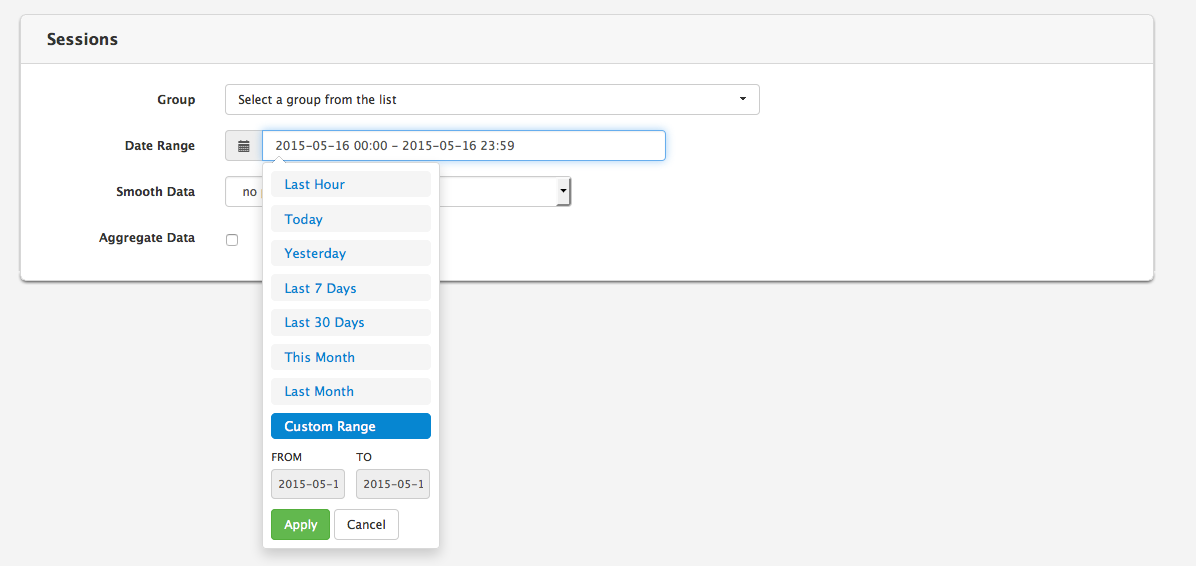
Use the Group drop-down menu to select the realms, labels, endpoints or trunks you want to inspect. Several items can be selected. In that case, you can check the Aggregate Data check-box to group statistics, or uncheck it to visualize them separately.
Smooth data: select a post-processing filter from the drop-down list to smooth the graph.
A simple moving average is the unweighted mean of the previous n data points. The number of data points, n, is calculated as a percentage of the total number of data points. The larger this percentage, the smoother the charts.
An exponential moving average is a weighted average that has exponentially decreasing weighting factors applied to the previous data points. The coefficient alpha represents the degree of weighting decrease. The smaller this value, the smoother the charts.
Use the Date Range drop-down menu to select one of the range options among these:
- Last hour
- Today
- Yesterday
- Last 7 days
- Last 30 days
- This month
- Last month
- Custom Range
Charts Types
NEMO provides charts for the calls statistics and voice quality statistics.
Two types of charts are available, depending on the selected metric.
Time-based charts illustrate the evolution of a particular metric over a specific time range, for example the evolution of traffic intensity over the last day.
Histogram-based charts illustrate the statistical distribution of values for a specific metric. A variant of the histogram chart is the pie chart, which illustrates proportions.
Charts Tools
Chart Overview
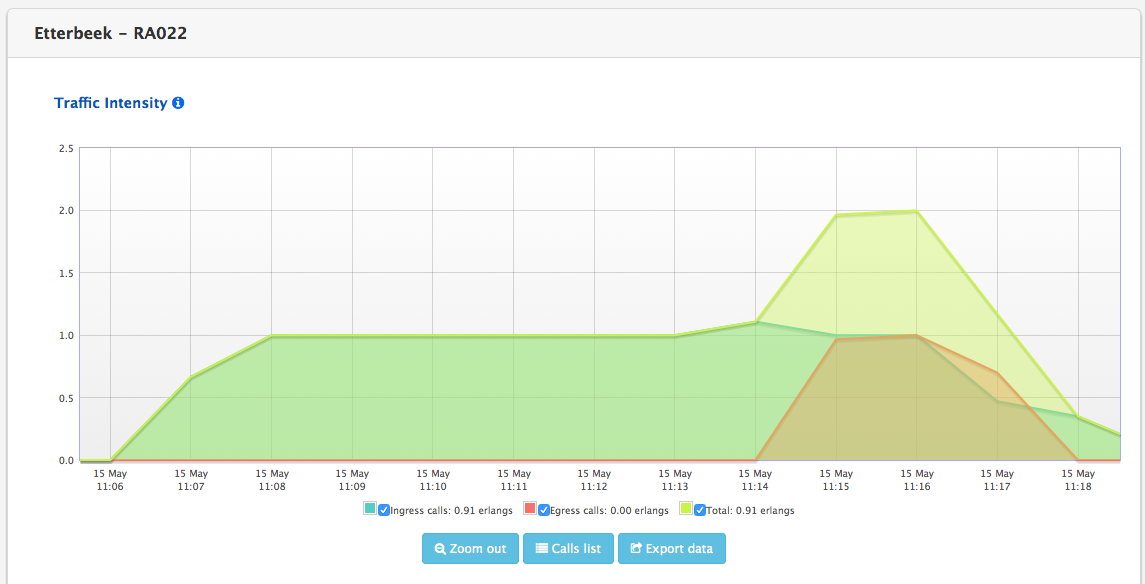
The charts displayed in the results window provide several tools illustrated below.
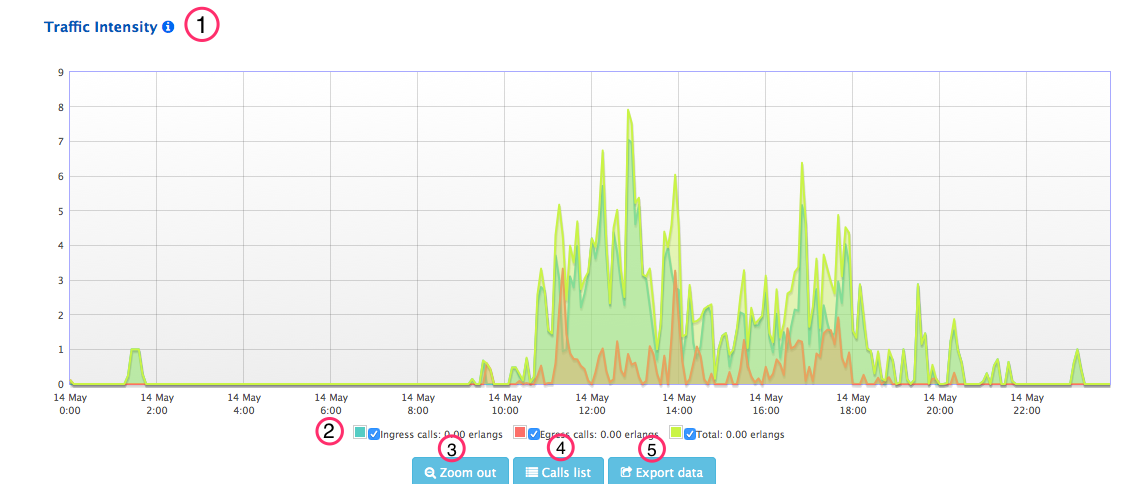
These tools include:
- The chart type
- The legend, providing the value for each series at the currently selected chart position (vertical blue line, used to select a position in the chart), with check-boxes to show or hide individual data series.
- Zoom out button: to reset the zoom to its original setting. Refer to the next section for zoom details.
- Calls list button: to retrieve the list of calls that occurred during this period of time and for this realm/trunk.
- Export data button: to consult and export the metrics data related to the chart.
WARNING
The legend (2) and buttons (3-4-5) are not available for some charts, depending on the chart's type and the data selection.
If appropriate data are available, the buttons are shown. Note also that the selection of several groups is authorized for listing calls and exporting data.
Zoom Tool
The Zoom feature allows seeing more precisely what happened during a specific period. To zoom in, click with the mouse at the desired start position, hold down the button, drag the mouse horizontally to the desired end position and release the button, as illustrated below.
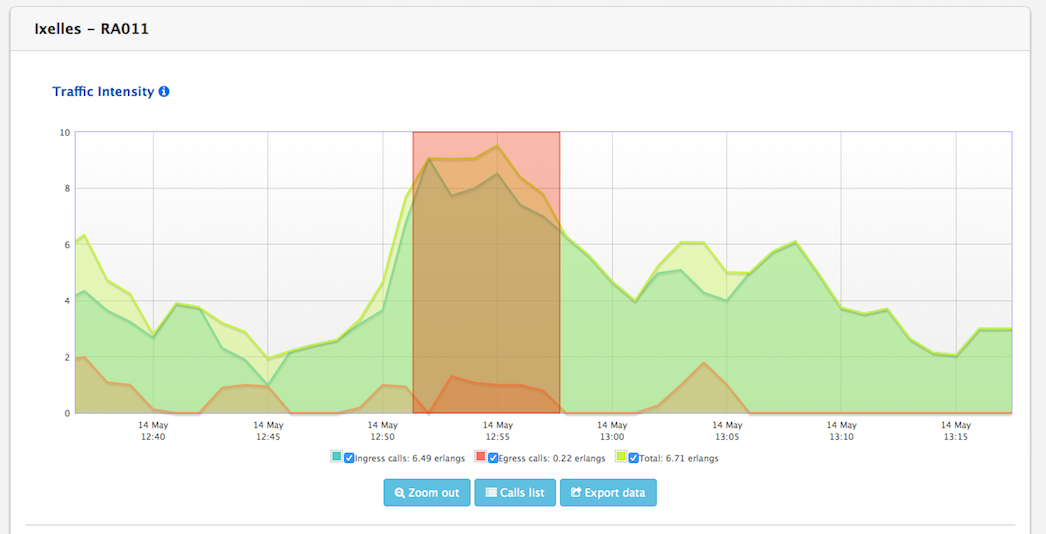
The chart precision will be refined dynamically to improve accuracy, as illustrated below. At the same time, the vertical range (Y-axis) is adapted to reflect the new values range.
Calls list button
The Calls list button conveniently opens the Search Calls browser page in the Calls module with the data selection active in the chart being displayed : group, date range.
However, the data selection in Search Calls being much more detailed, you will have to confirm and possibly complete that selection on the Search Calls page, and validate it by clicking the Search button to display the corresponding list of calls. Please refer to Search Calls for more information.
Export Data Tool
The Export data button allows retrieving the raw data used to compute and plot the graph. These data can also be exported as a CSV file. When clicking this button, the Data Export window is displayed, as illustrated below.
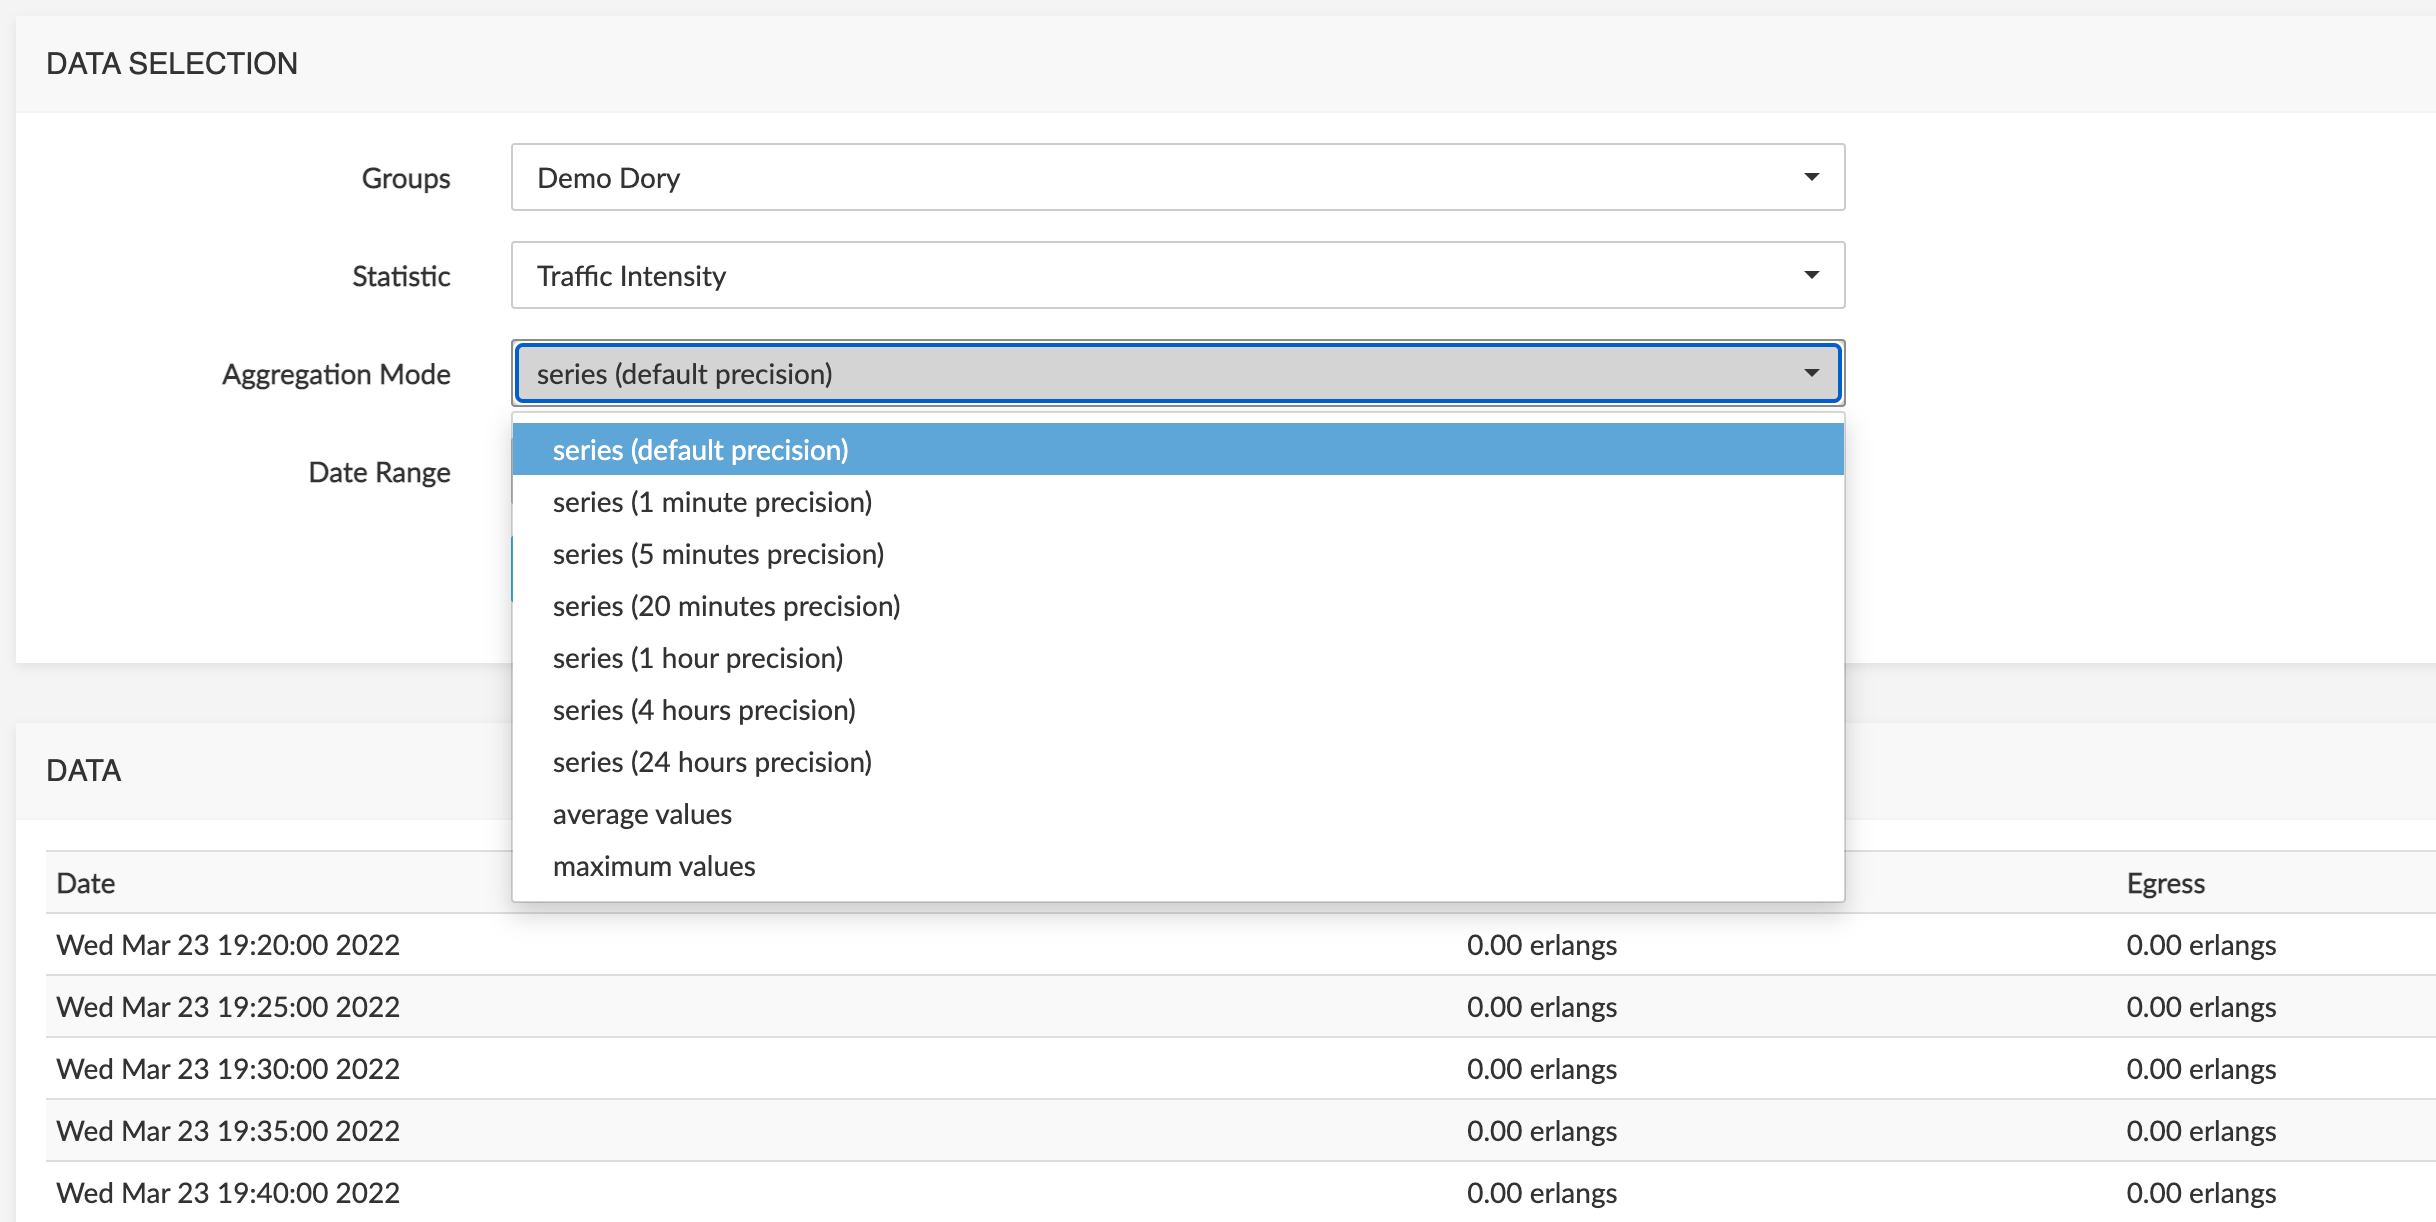
The Data Selection zone shows the following elements:
- The Group drop-down menu allows selecting a particular realm, label, endpoint or trunk.
- The Statistics drop-down menu allows selecting the metric you are interested in.
- The Aggregation Mode drop-down menu allows you to select the precision among the possible values: 1 minute, 5 minutes, 20 minutes, 1 hour, 4 hours or 24 hours. This determines the time step in the results table. Alternatively, you can select the average, maximum values or default precision (recommended value).
- The Date Range indicates the desired time range.
Click the Retrieve data button to refresh the raw data display in the DATA list. Changing the values of any of the selected elements is allowed, for example to change the Date range, etc.
Click the Export as CSV button to export the raw data as a CSV file.
Calls Statistics Module
The Calls Statistics module is divided in five sub-menus, each containing several charts described in the tables below. These statistics are computed based on the signaling metrics present in the CDRs generated by the SBCs, or in the data captured by the probes, or both ("hybrid mode" or "multi-plugins mode" ). See [Call data and Trace data -- Understanding the differences] for more information.
Sessions
| Title | Description | Type | Unit |
|---|---|---|---|
| Total Capacity Usage | This chart illustrates the proportion of time where various levels of total capacity usage have been reached. | Pie | Proportion (%) |
| Minutes of Usage | This chart describes the total duration of calls in minutes, hourly or daily, depending on the window of time selected. | Time-based | Minutes |
| Calls Count over Time | This chart shows the number of calls per hour or per day. | Time-based | Number of calls |
| Traffic Intensity | This chart illustrates the number of voice channels busy. | Time-based | Erlangs |
| Maximum Simultaneous Calls | This chart shows a measurement of the maximum number of concurrent channels busy. | Time-based | Number of voice channels |
| Call Rate | This chart illustrates the number of call setup attempts (successful or failed) per second. | Time-based | Calls/second |
Registrations
| Title | Description | Type | Unit |
|---|---|---|---|
| Active Registrations | This chart shows the number of successfully registered subscribers over time. | Time-based | Ingress/Egress Registrations |
| Registrations Rate | This chart shows the number of registration attempts (successful and failed) per second. | Time-based | Proportion (%) |
Call Durations
| Title | Description | Type | Unit |
|---|---|---|---|
| Connection Phase Duration Distribution | The connection phase is the period of time between the moment the call is answered (connected) and the moment the call is released (disconnected). This chart represents the distribution of these durations. Each bar represents the percentage of calls (vertical axis) which have a specific duration (horizontal axis). | Histogram | Proportion (%) |
| Average Connection Phase Duration | This chart illustrates the evolution of the average calls connection duration over time. | Time-based | Seconds |
| Alerting Phase Duration Distribution | The alerting (ringing) phase is the period of time between the moment the call is initiated (setup) and the moment the call is answered (connected). This chart represents the distribution of these durations. Each bar represents the percentage of calls (vertical axis) which have a specific duration (horizontal axis). | Histogram | Proportion (%) |
| Average Alerting Phase Duration | This chart illustrates the evolution of the average calls alerting phase duration over time. | Time-based | Seconds |
| Post Dial Delay | Post dial delay is the time between the start of the call and the moment the phone of the called party starts ringing. | Time-based | Milliseconds |
| Post Dial Delay Distribution | Post dial delay is the time between the start of the call and the moment the phone of the called party starts ringing. This histogram represents the distribution of these durations. Each bar represents the percentage of calls (vertical axis) which have a specific post dial delay (horizontal axis). | Histogram | Proportion (%) |
Caller and Callee Distribution
The charts listed in the table below exist for each combinations of:
- direction: ingress or egress
- party: calling party number (caller) or called party number (callee)
- metric type: volume (number of minutes) or count (number of calls)
From the base 3 type of charts: National vs International, National and International breakdowns, 24 different charts are available.
| Title | Description | Type | Unit |
|---|---|---|---|
| Ingress Callee Distribution: International (Count) | This chart illustrates the called party number distribution for international calls. Calculation is based on number of calls. | Pie | Proportion (%) |
| Ingress Callee Distribution: International (Volume) | This chart illustrates the called party number distribution for international calls. Calculation is based on volume. | Pie | Proportion (%) |
| Ingress Callee Distribution: National (Count) | This chart illustrates the called party number distribution for national calls. Calculation is based on number of calls. | Pie | Proportion (%) |
| Ingress Callee Distribution: National (Volume) | This chart illustrates the called party number distribution for national calls. Calculation is based on volume. | Pie | Proportion (%) |
| Ingress Callee Distribution: National vs International (Count) | This chart illustrates the called party number distribution between national and international calls. Calculation is based on number of calls. | Pie | Proportion (%) |
| Ingress Callee Distribution: National vs International (Volume) | This chart illustrates the called party number distribution between national and international calls. Calculation is based on volume. | Pie | Proportion (%) |
| Ingress Caller Distribution: International (Count) | This chart illustrates the calling party number distribution for international calls. Calculation is based on number of calls. | Pie | Proportion (%) |
| Ingress Caller Distribution: International (Volume) | This chart illustrates the calling party number distribution for international calls. Calculation is based on volume. | Pie | Proportion (%) |
| Ingress Caller Distribution: National (Count) | This chart illustrates the calling party number distribution for national calls. Calculation is based on number of calls. | Pie | Proportion (%) |
| Ingress Caller Distribution: National (Volume) | This chart illustrates the calling party number distribution for national calls. Calculation is based on volume. | Pie | Proportion (%) |
| Ingress Caller Distribution: National vs International (Count) | This chart illustrates the calling party number distribution between national and international calls. Calculation is based on number of calls. | Pie | Proportion (%) |
| Ingress Caller Distribution: National vs International (Volume) | This chart illustrates the calling party number distribution between national and international calls. Calculation is based on volume. | Pie | Proportion (%) |
| Egress Callee Distribution: International (Count) | This chart illustrates the called party number distribution for international calls. Calculation is based on number of calls. | Pie | Proportion (%) |
| Egress Callee Distribution: International (Volume) | This chart illustrates the called party number distribution for international calls. Calculation is based on volume. | Pie | Proportion (%) |
| Egress Callee Distribution: National (Count) | This chart illustrates the called party number distribution for national calls. Calculation is based on number of calls. | Pie | Proportion (%) |
| Egress Callee Distribution: National (Volume) | This chart illustrates the called party number distribution for national calls. Calculation is based on volume. | Pie | Proportion (%) |
| Egress Callee Distribution: National vs International (Count) | This chart illustrates the called party number distribution between national and international calls. Calculation is based on number of calls. | Pie | Proportion (%) |
| Egress Callee Distribution: National vs International (Volume) | This chart illustrates the called party number distribution between national and international calls. Calculation is based on volume. | Pie | Proportion (%) |
| Egress Caller Distribution: International (Count) | This chart illustrates the calling party number distribution for international calls. Calculation is based on number of calls. | Pie | Proportion (%) |
| Egress Caller Distribution: International (Volume) | This chart illustrates the calling party number distribution for international calls. Calculation is based on volume. | Pie | Proportion (%) |
| Egress Caller Distribution: National (Count) | This chart illustrates the calling party number distribution for national calls. Calculation is based on number of calls. | Pie | Proportion (%) |
| Egress Caller Distribution: National (Volume) | This chart illustrates the calling party number distribution for national calls. Calculation is based on volume. | Pie | Proportion (%) |
| Egress Caller Distribution: National vs International (Count) | This chart illustrates the calling party number distribution between national and international calls. Calculation is based on number of calls. | Pie | Proportion (%) |
| Egress Caller Distribution: National vs International (Volume) | This chart illustrates the calling party number distribution between national and international calls. Calculation is based on volume. | Pie | Proportion (%) |
Release Causes
| Title | Description | Type | Unit |
|---|---|---|---|
| Ingress/Egress Calls Disconnect Causes Distribution | The charts illustrate the distribution of individual SIP error codes *. | Pie | Proportion (%) |
| Ingress/Egress Calls ISDN Causes Distribution | The charts illustrate the distribution of ISDN disconnect causes. The possible ISDN cause are define in ITU-T Q850 specification *. | Pie | Proportion (%) |
| Ingress/Egress Calls SIP Status Distribution | The charts illustrate the distribution of calls SIP error codes for ingress and egress calls. The possible SIP error codes are defined in IETF RFC 3261. | Pie | Proportion (%) |
| Session Establishment Ratio | The Session Establishment ratio (SER, also known as Answer Seizure Ratio, ASR) is the percentage of calls answered with respect to the total number of call attempts. The scale goes form 0% (no calls answered) to 100% (all calls answered). | Histogram | Proportion (%) |
| Session Establishment Effectiveness Ratio | The Session Establishment Effectiveness Ratio (SEER, also known as Network Efficiency Ratio, NER) is the percentage of calls answered with respect to the total number of call attempts. Calls released because User busy, No answer, etc... are excluded form this metric. It is designed to eliminate user behaviour as a factor and better represent pure network performance. | Histogram | Proportion (%) |
| Ineffective Session Attempts Ratio | The ineffective session attempts ratio (ISA) is the percentage of calls released with a failed or overload condition. The scale goes from 0% (no ineffective session attempts) to 100% (all session attempts are ineffective). | Histogram | Proportion (%) |
* These charts are specific to Oracle SBC and will not appear if Probes / Trace Capture are used.
Voice Quality Module
The Voice Quality module is divided in seven sub-menus, each presenting several charts as described in the tables below. These statistics are computed based on the media metrics present in the CDRs generated by the SBC, or in the data captured by the probes if present, or both ("hybrid mode", see [Call data and Trace data -- Understanding the differences]).
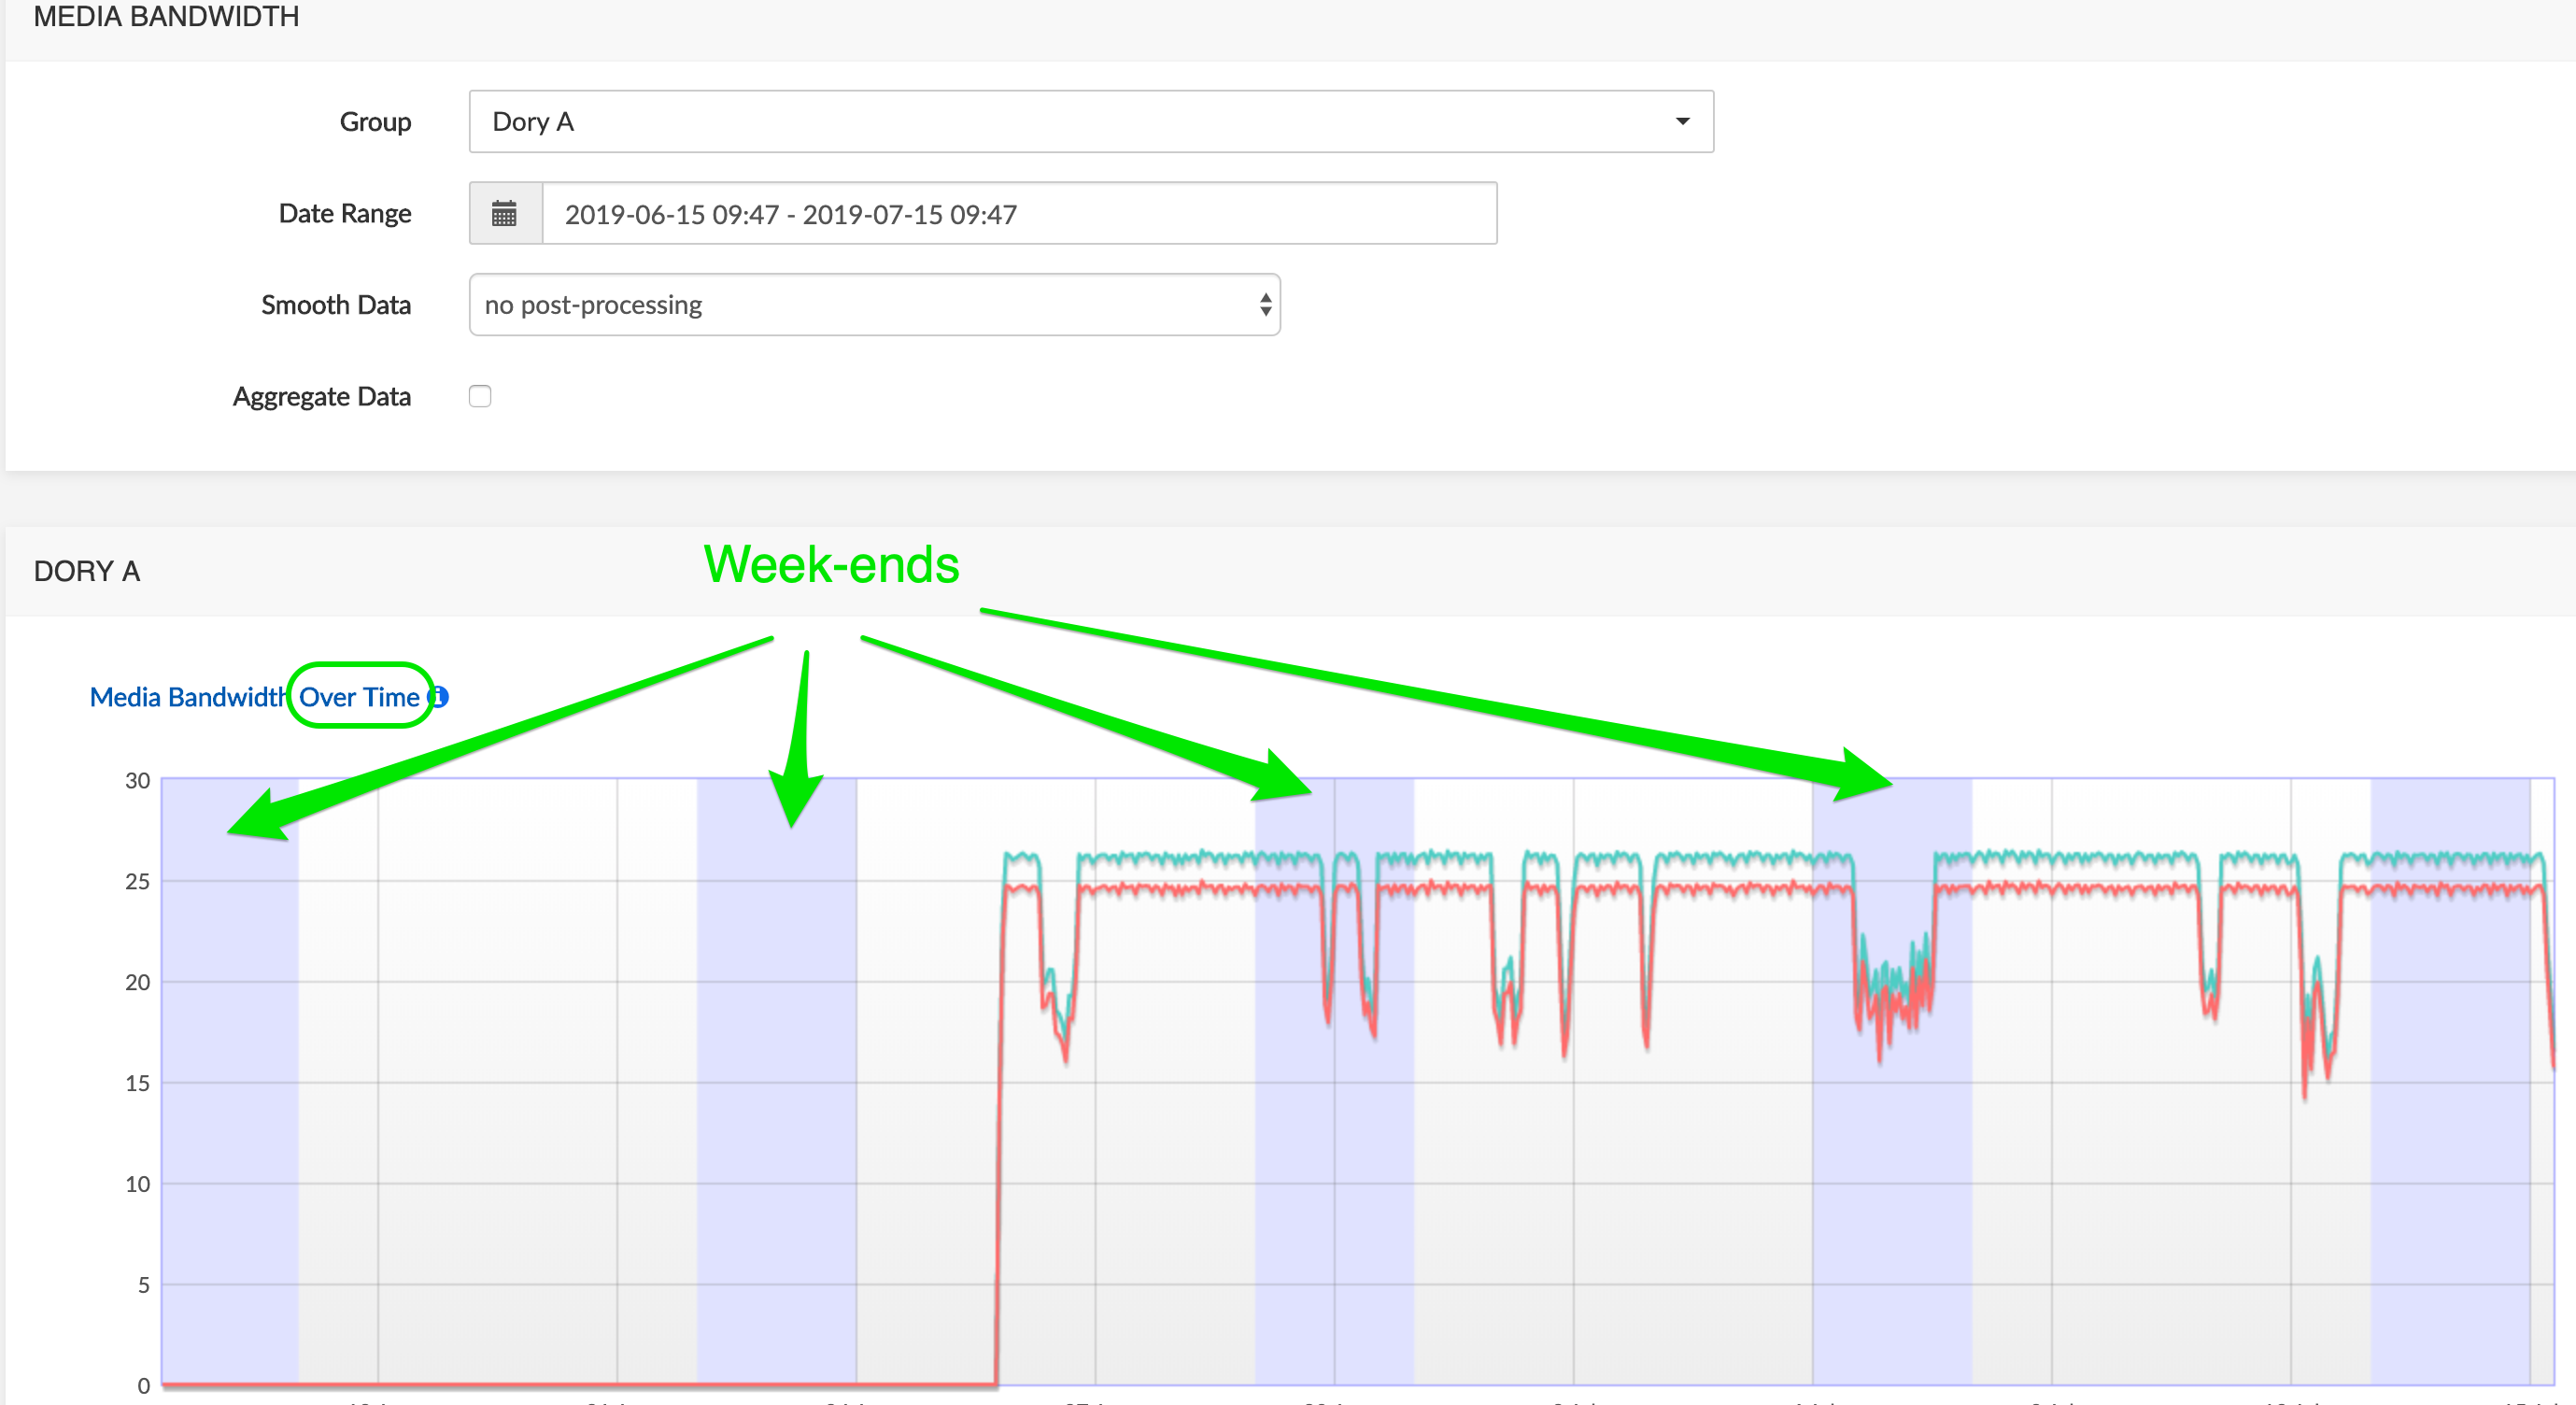
In the graphs plotting data Over Time, the light violet bars show week-ends:
Packet Loss
| Title | Description | Type | Unit |
|---|---|---|---|
| RTP Average Packet Loss Distribution | Packet loss occurs when one or more packets of RTP data travelling across a VoIP network fail to reach their destination. This chart represents the packet loss distribution: for each interval indicating a packet loss level on the horizontal axis, the bar height indicates the percentage of calls affected by this packet loss level. The statistics are measured based on the RTP flows observed by the SBC. | Histogram | Proportion (%) |
| RTP Average Packet Loss Over Time | The chart illustrates the evolution of the proportion of packets lost over time, based on the RTP streams observed by the SBC. | Time-based | Proportion (%) |
| RTCP Average Packet Loss Distribution | The chart illustrates the packet loss distribution (expressed in percentage). The statistics are measured based on the RTCP reports sent by both call endpoints. The accuracy of the RTCP reports can vary depending on the endpoint type. | Histogram | Proportion (%) |
| RTCP Average Packet Loss Over Time | The chart illustrates the evolution of the proportion of packets lost over time. The statistics are measured based on the RTCP reports sent by both call endpoints. The accuracy of the RTCP reports can vary depending on the endpoint type. | Time-based | Proportion (%) |
Packet Jitter
| Title | Description | Type | Unit |
|---|---|---|---|
| RTP Average Jitter Distribution | Jitter is the variability over time of the packet latency across a network. This chart represents the jitter distribution: for each interval indicating a jitter level in milliseconds, the bar height indicates the percentage of calls affected by this jitter level. The statistics are measured based on the RTP flows observed by the SBC. | Histogram | Proportion (%) |
| RTP Average Jitter Over Time | This chart represents the measured jitter over time. The statistics are measured based on the RTP flows observed by the SBC. | Time-based | Milliseconds |
| RTCP Average Jitter Distribution | This chart represents the jitter distribution: for each interval indicating a jitter level in ms, the bar height indicates the percentage of calls affected by this jitter level. The statistics are measured based on the RTCP reports sent by both call endpoints. The accuracy of the RTCP reports can vary depending on the endpoint type. | Histogram | Proportion (%) |
| RTCP Average Jitter Over Time | This chart represents the measured jitter over time. The statistics are measured based on the RTCP reports sent by both call endpoints. The accuracy of the RTCP reports can vary depending on the endpoint type. | Time-based | Milliseconds |
Packet Latency
| Title | Description | Type | Unit |
|---|---|---|---|
| RTCP Max Latency Distribution | One-way packet latency is the time between the moment a voice packet is transmitted and the moment it reaches its destination. It leads to delay and may lead to echo. This chart represents the maximum latency distribution: for each interval indicating a maximum delay on the horizontal axis, the bar height indicates the percentage of calls affected by this delay. The statistic endpoints. The accuracy of the RTCP reports can vary depending on the endpoint type. | Histogram | Proportion (%) |
| RTCP Avg Latency Distribution | This chart represents the average latency distribution: for each interval indicating an average delay on the horizontal axis, the bar height indicates the percentage of calls affected by this delay. The statistics are measured based on the RTCP reports sent by both call endpoints. The accuracy of the RTCP reports can vary depending on the endpoint type. | Histogram | Proportion (%) |
MOS
| Title | Description | Type | Unit |
|---|---|---|---|
| Ingress/Egress MOS Overview | The charts illustrate the proportion of calls with various predefined score levels. Some SBC releases do not provide the MOS value. In this case, the MOS is calculated by NEMO, according to ITU-T recommendation G.107. | Pie | Proportion (%) |
| RTP MOS Distribution | This chart represents the Mean Observation Score distribution: for each interval indicating a score on the horizontal axis, the bar height indicates the percentage of calls with this score. Some SBC releases do not provide the MOS value. In this case, the MOS is calculated by NEMO, according to ITU-T recommendation G.107. | Histogram | Proportion (%) |
| RTP MOS Over Time | The chart illustrates the evolution of the Mean Observation Score (expressed as a score) calculated by the SBC over time. Some SBC releases do not provide the MOS value. In this case, the MOS is calculated by NEMO, according to ITU-T recommendation G.107. | Time-based | Score |
R-Factor
| Title | Description | Type | Unit |
|---|---|---|---|
| R-Factor Distribution | This histogram represents the R-Factor distribution: for each interval indicating a score on the horizontal axis, the bar height indicates the percentage of calls with this score. | Histogram | Proportion (%) |
| R-Factor Over time | This chart represents the R-Factor over time. | Histogram | Proportion (%) |
Codecs
| Title | Description | Type | Unit |
|---|---|---|---|
| Codecs Distribution | The chart illustrates the distribution of codecs for ingress & egress calls. | Pie | Proportion (%) |
| Packetization Time distribution | The chart illustrates the distribution of the packetization time for ingress & egress calls. | Pie | Proportion (%) |
Media Bandwidth
| Title | Description | Type | Unit |
|---|---|---|---|
| Media bandwidth Over Time | The chart illustrates the evolution of the bandwidth consumption. Calculation is based on the "bytes sent/received" information received in the CDRs. | Time-based | Seconds |
Calls Module : Searching Calls and Traces
The Calls module allows searching the CDRs stored in the database to analyse calls.
It also allows searching call traces (see [Search Traces]) and analyzing traces (see [Trace Analysis]), downloaded from the Search Calls tool or captured externally.
Call Data and Trace Data - Understanding the Differences
Call data come from the CDRs stored in the database, originating from the third-party equipment being monitored.
Trace data come from traces captured by the probes, if present, or by an external trace capture tool. The probes create their own internal CDRs.
Call details in Search Calls display:
- in a deployment with network equipment and installed plugin: the data available in the CDRs from the equipment being monitored
- in a deployment with probes only: the data available in the internal CDRs from the trace, and a link to the end-to-end call trace
- in a deployment with third-party equipment, plugin and probes ("hybrid mode"): a combination of data from both CDRs.
Search Calls
The Search Calls command allows selecting:
the device that will be searched (Capture, Netnetsd, Broadsoft, etc.)
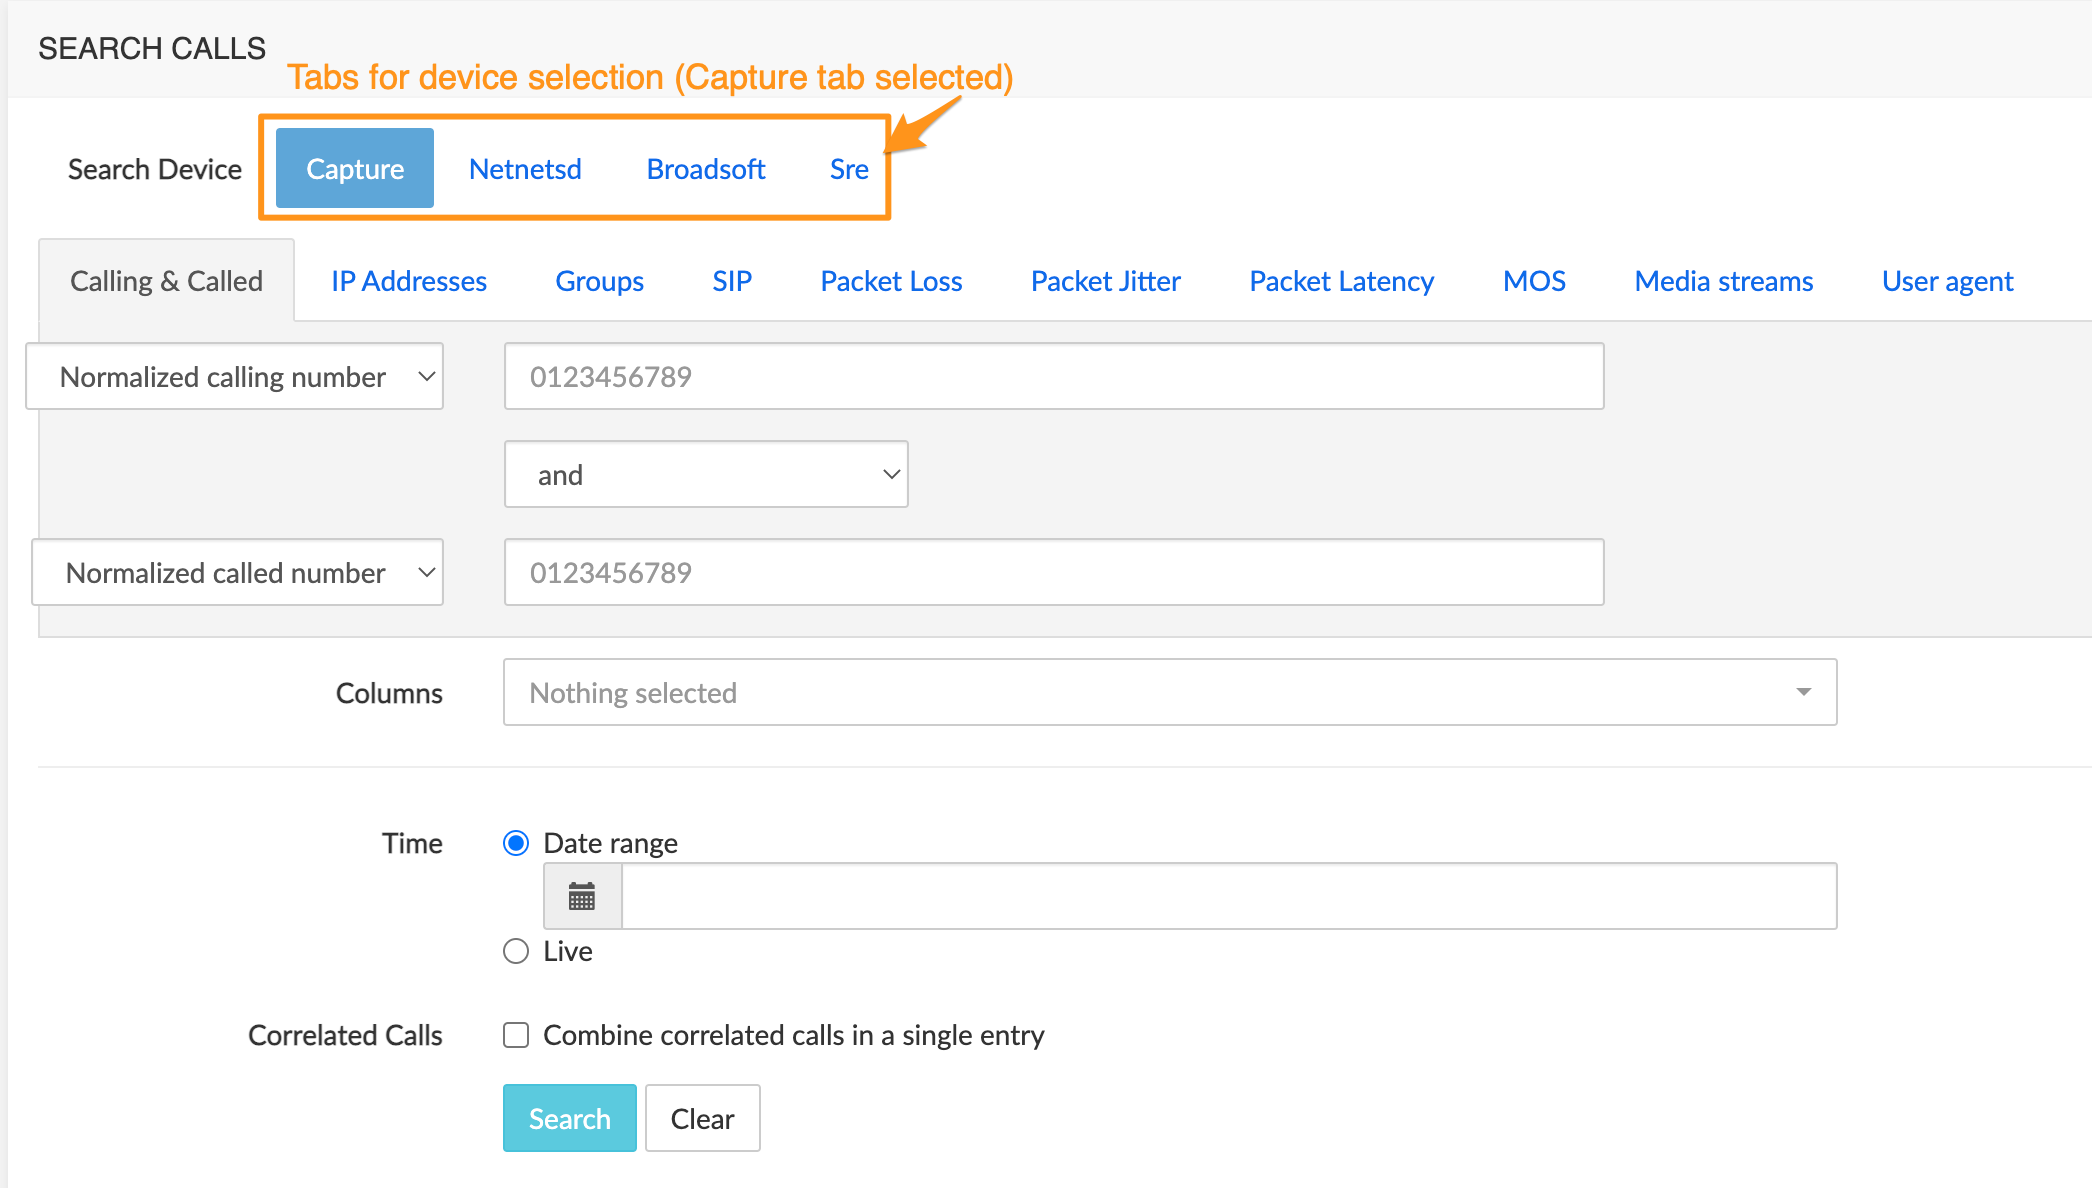
calls within this device, according to a very extended set of criteria, grouped in tabs.
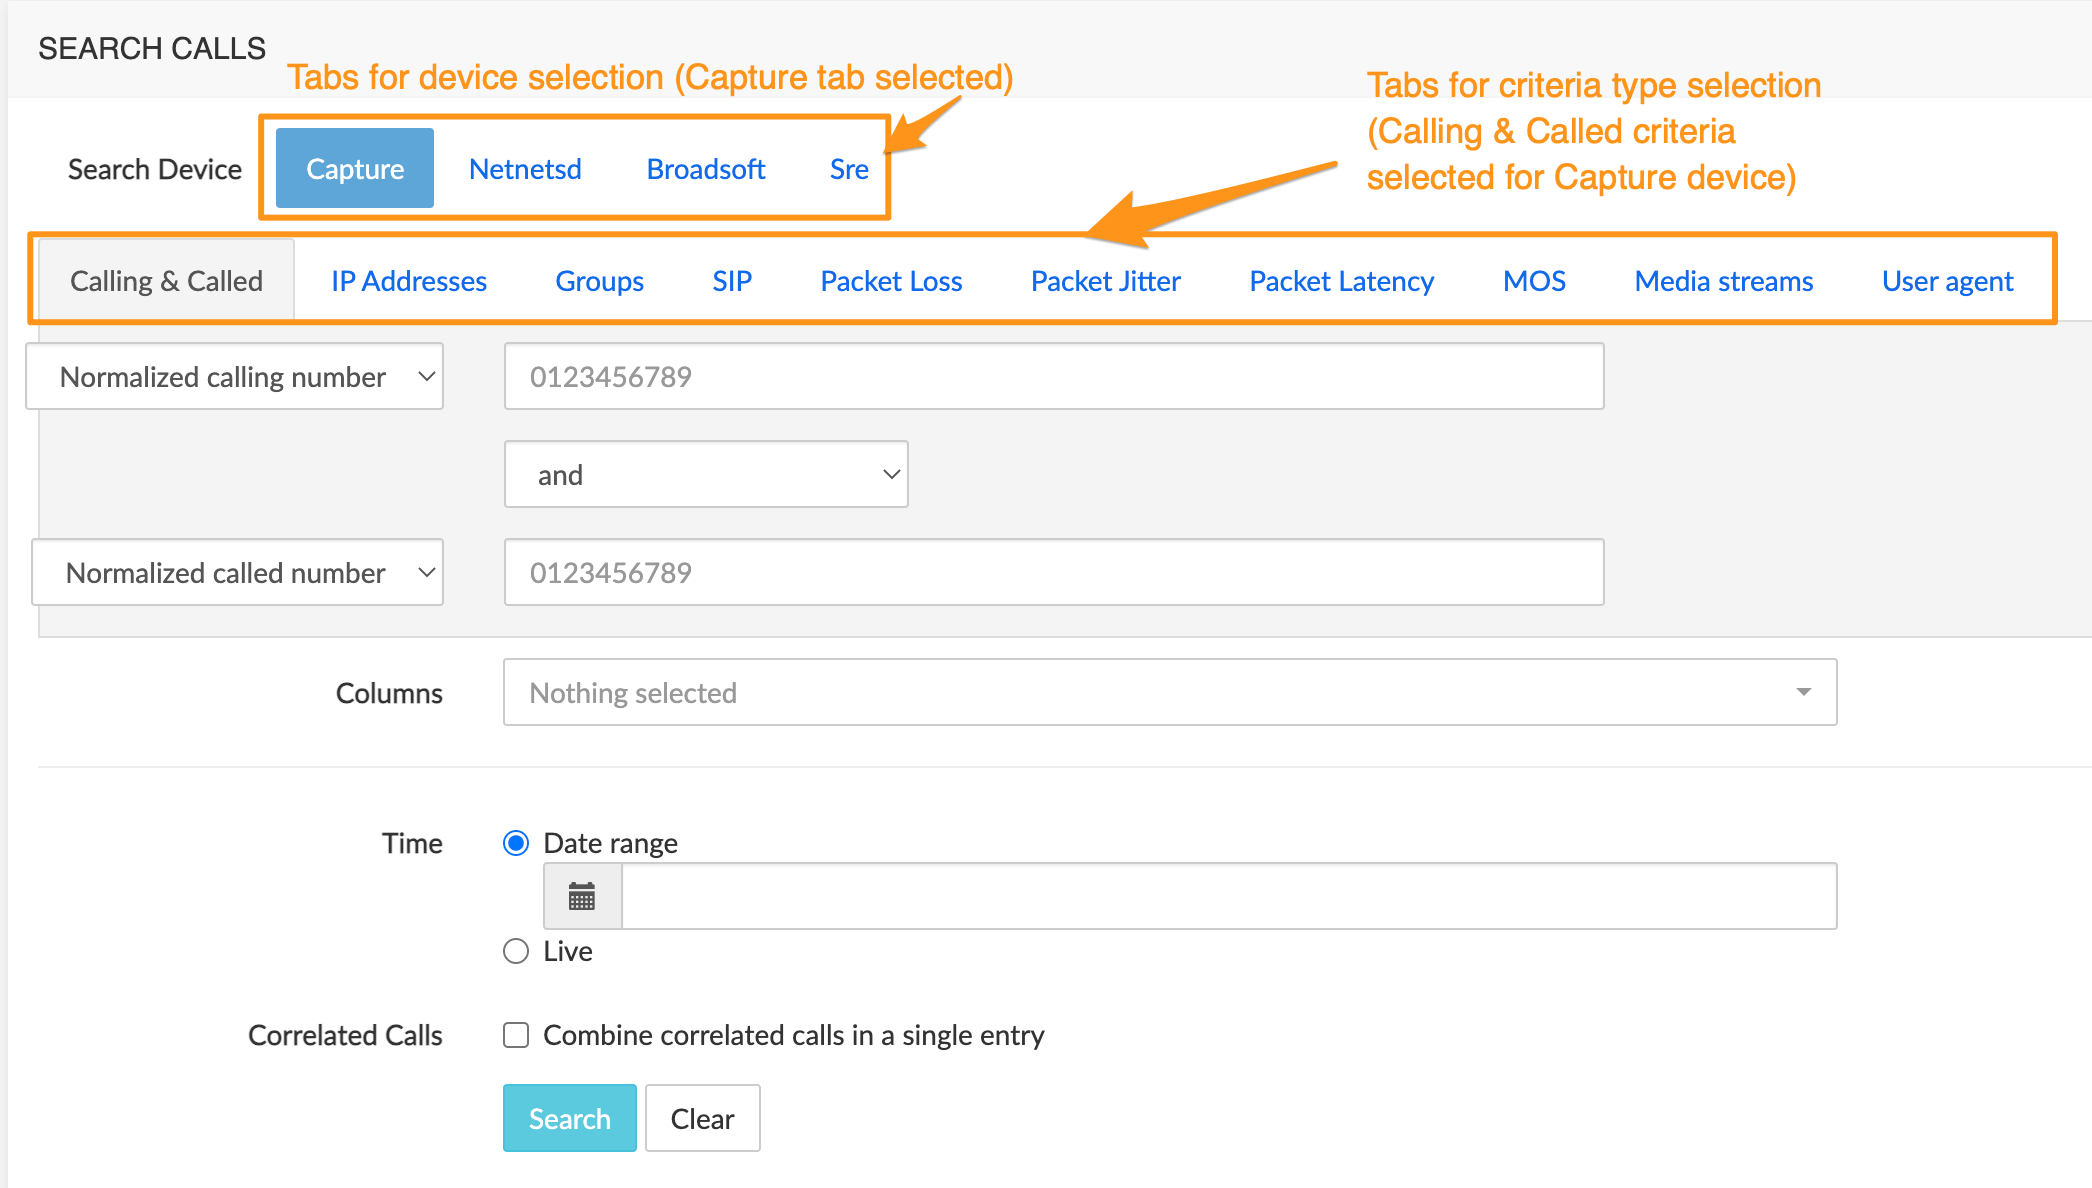
Search Criteria
Tabs/criteria are device-specific: not all tabs/criteria are available for each device or shown in each device tab. Calling & Called, IP Addresses and Groups tabs/criteria are common to all devices.
Criteria Common to all Tabs: Sources and Destinations
Calling and Called
WARNING
Calls can be searched either by specifying the first digits of the normalized number (e.g. 123, 123456) or by specifying the original party. In the later case, * may be used as wildcard (e.g. 123456, 123*, *456).
The Normalized calling number and Normalized called number drop-down boxes allow specifying criteria for the calling and/or called party numbers, in normalized or original format (see Warning above). The search results will return all calls from and/or to the numbers specified in the criteria as selected via the drop-down list.
IP Addresses tab
The Ingress remote address and Egress remote address text fields allow specifying one IP address for ingress traffic and/or one for egress traffic. IPv6 format is supported.
Groups tab
The Ingress group / Egress group drop-down lists allow specifying a combination of ingress and/or egress entities (including labels).
For device-specific criteria, refer to the chapter [Plugins Features List].
Other Common Criteria
Time / Date Range The Date Range drop-down box allows specifying the time range using one the following criteria:
- Last Hour
- Last 4 Hours
- Last 12 Hours
- Last 24 Hours
- Today (all calls from today 00:00 until 23:59).
- Yesterday (all calls from yesterday 00:00 until yesterday 23:59).
- Last 7 days
- Custom Range (allows defining a customized range)

The Live radio button under Date Range switches from the time window-based range mode to live mode, allowing to automatically refresh the results by performing a new search at regular intervals. When Live is active, the Search button becomes Start. Click it to launch the live search; when started, click it again (Stop) to stop the live search mode.
Columns The Columns drop-down menu allows specifying additional parameters that will be displayed in the search results. The following parameters are present by default in the result:
- Start Time
- End Time
- Calling Number
- Called Number
- Ingress Group
- Egress Group
Using the Columns drop-down menu, other items can be added to the search results. For device-specific criteria, refer to the chapter [Plugins Features List].
Correlated calls When checked, all call legs of multi-legs calls are grouped into one line. All details remain available, see below [Display Call Details].
Search Results Browser (Calls)
Once the search criteria are supplied, click the Search button. The search results are displayed in the Search Results browser.

Release Cause Color Code
Note the vertical bar on the left (in the blue square): the color shows the release cause of the call according to the code below:
- pink: live
- green: successful call (2XX and BYE)
- blue: redirected call (3XX)
- orange: «soft» error (No answer, Busy, etc.) (4XX and CANCEL)
- red: severe error (server down, etc.) (5XX and 6XX)
INFO
This feature is not supported by all plugins.
Display Call Details
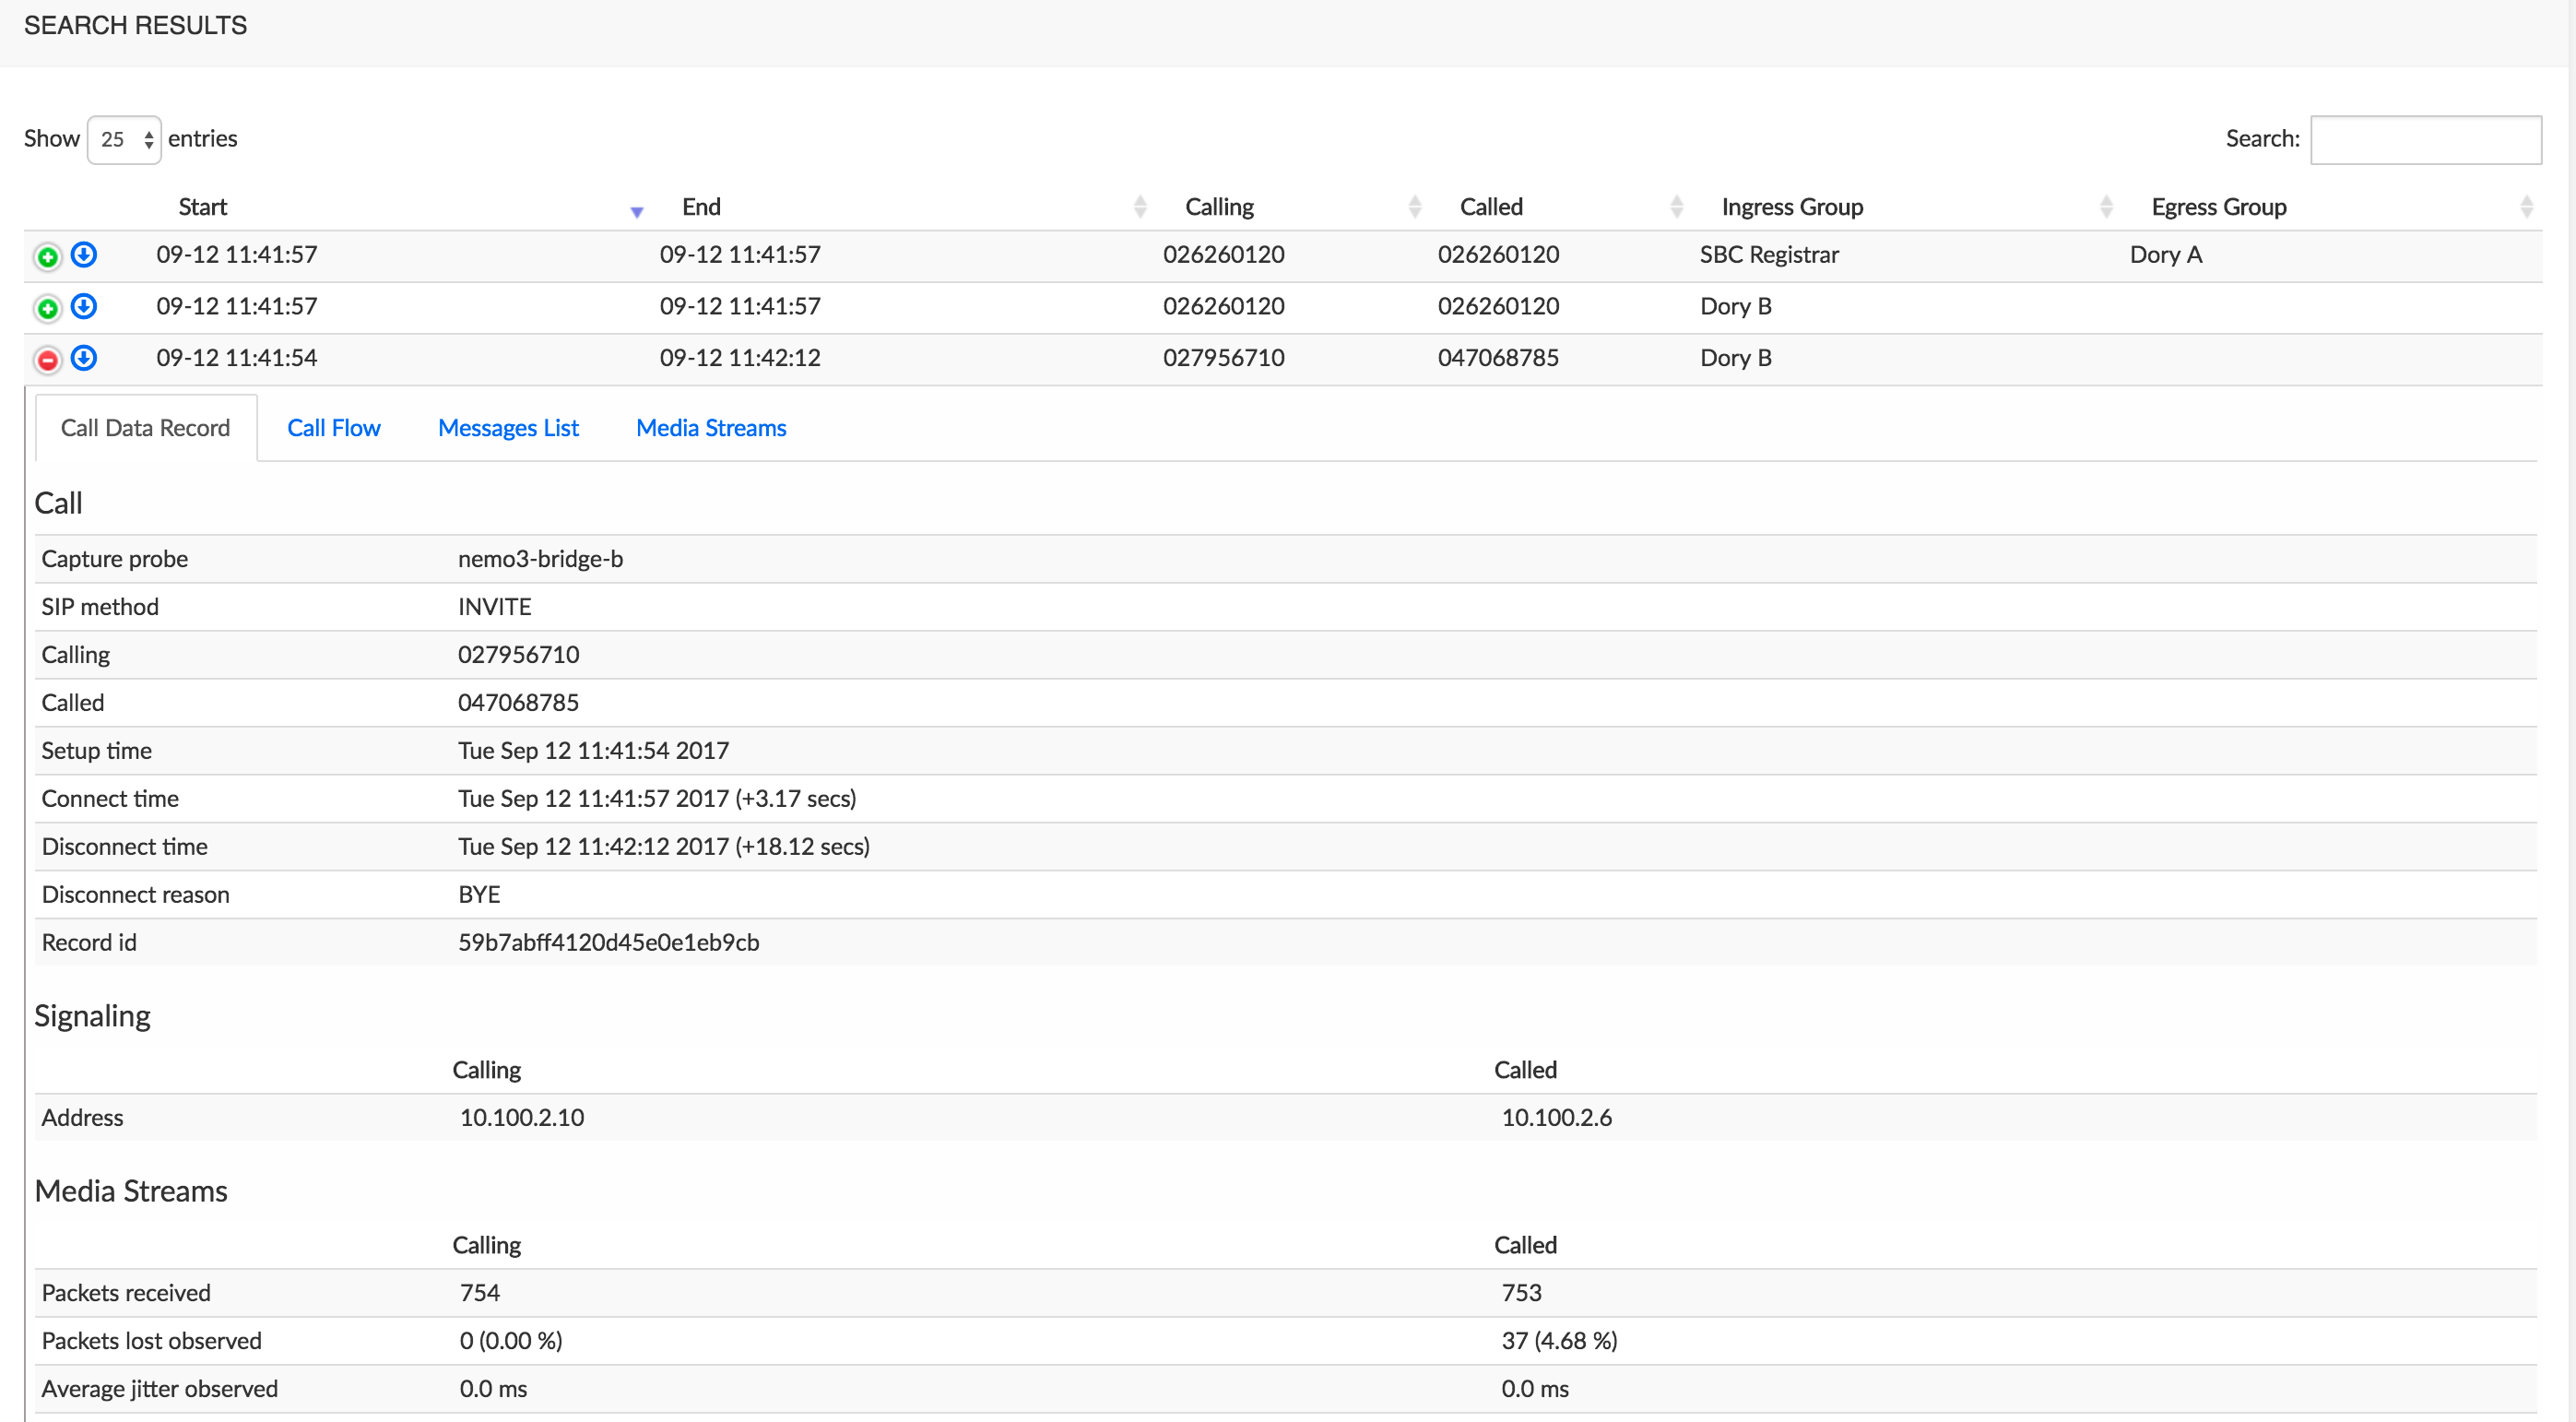
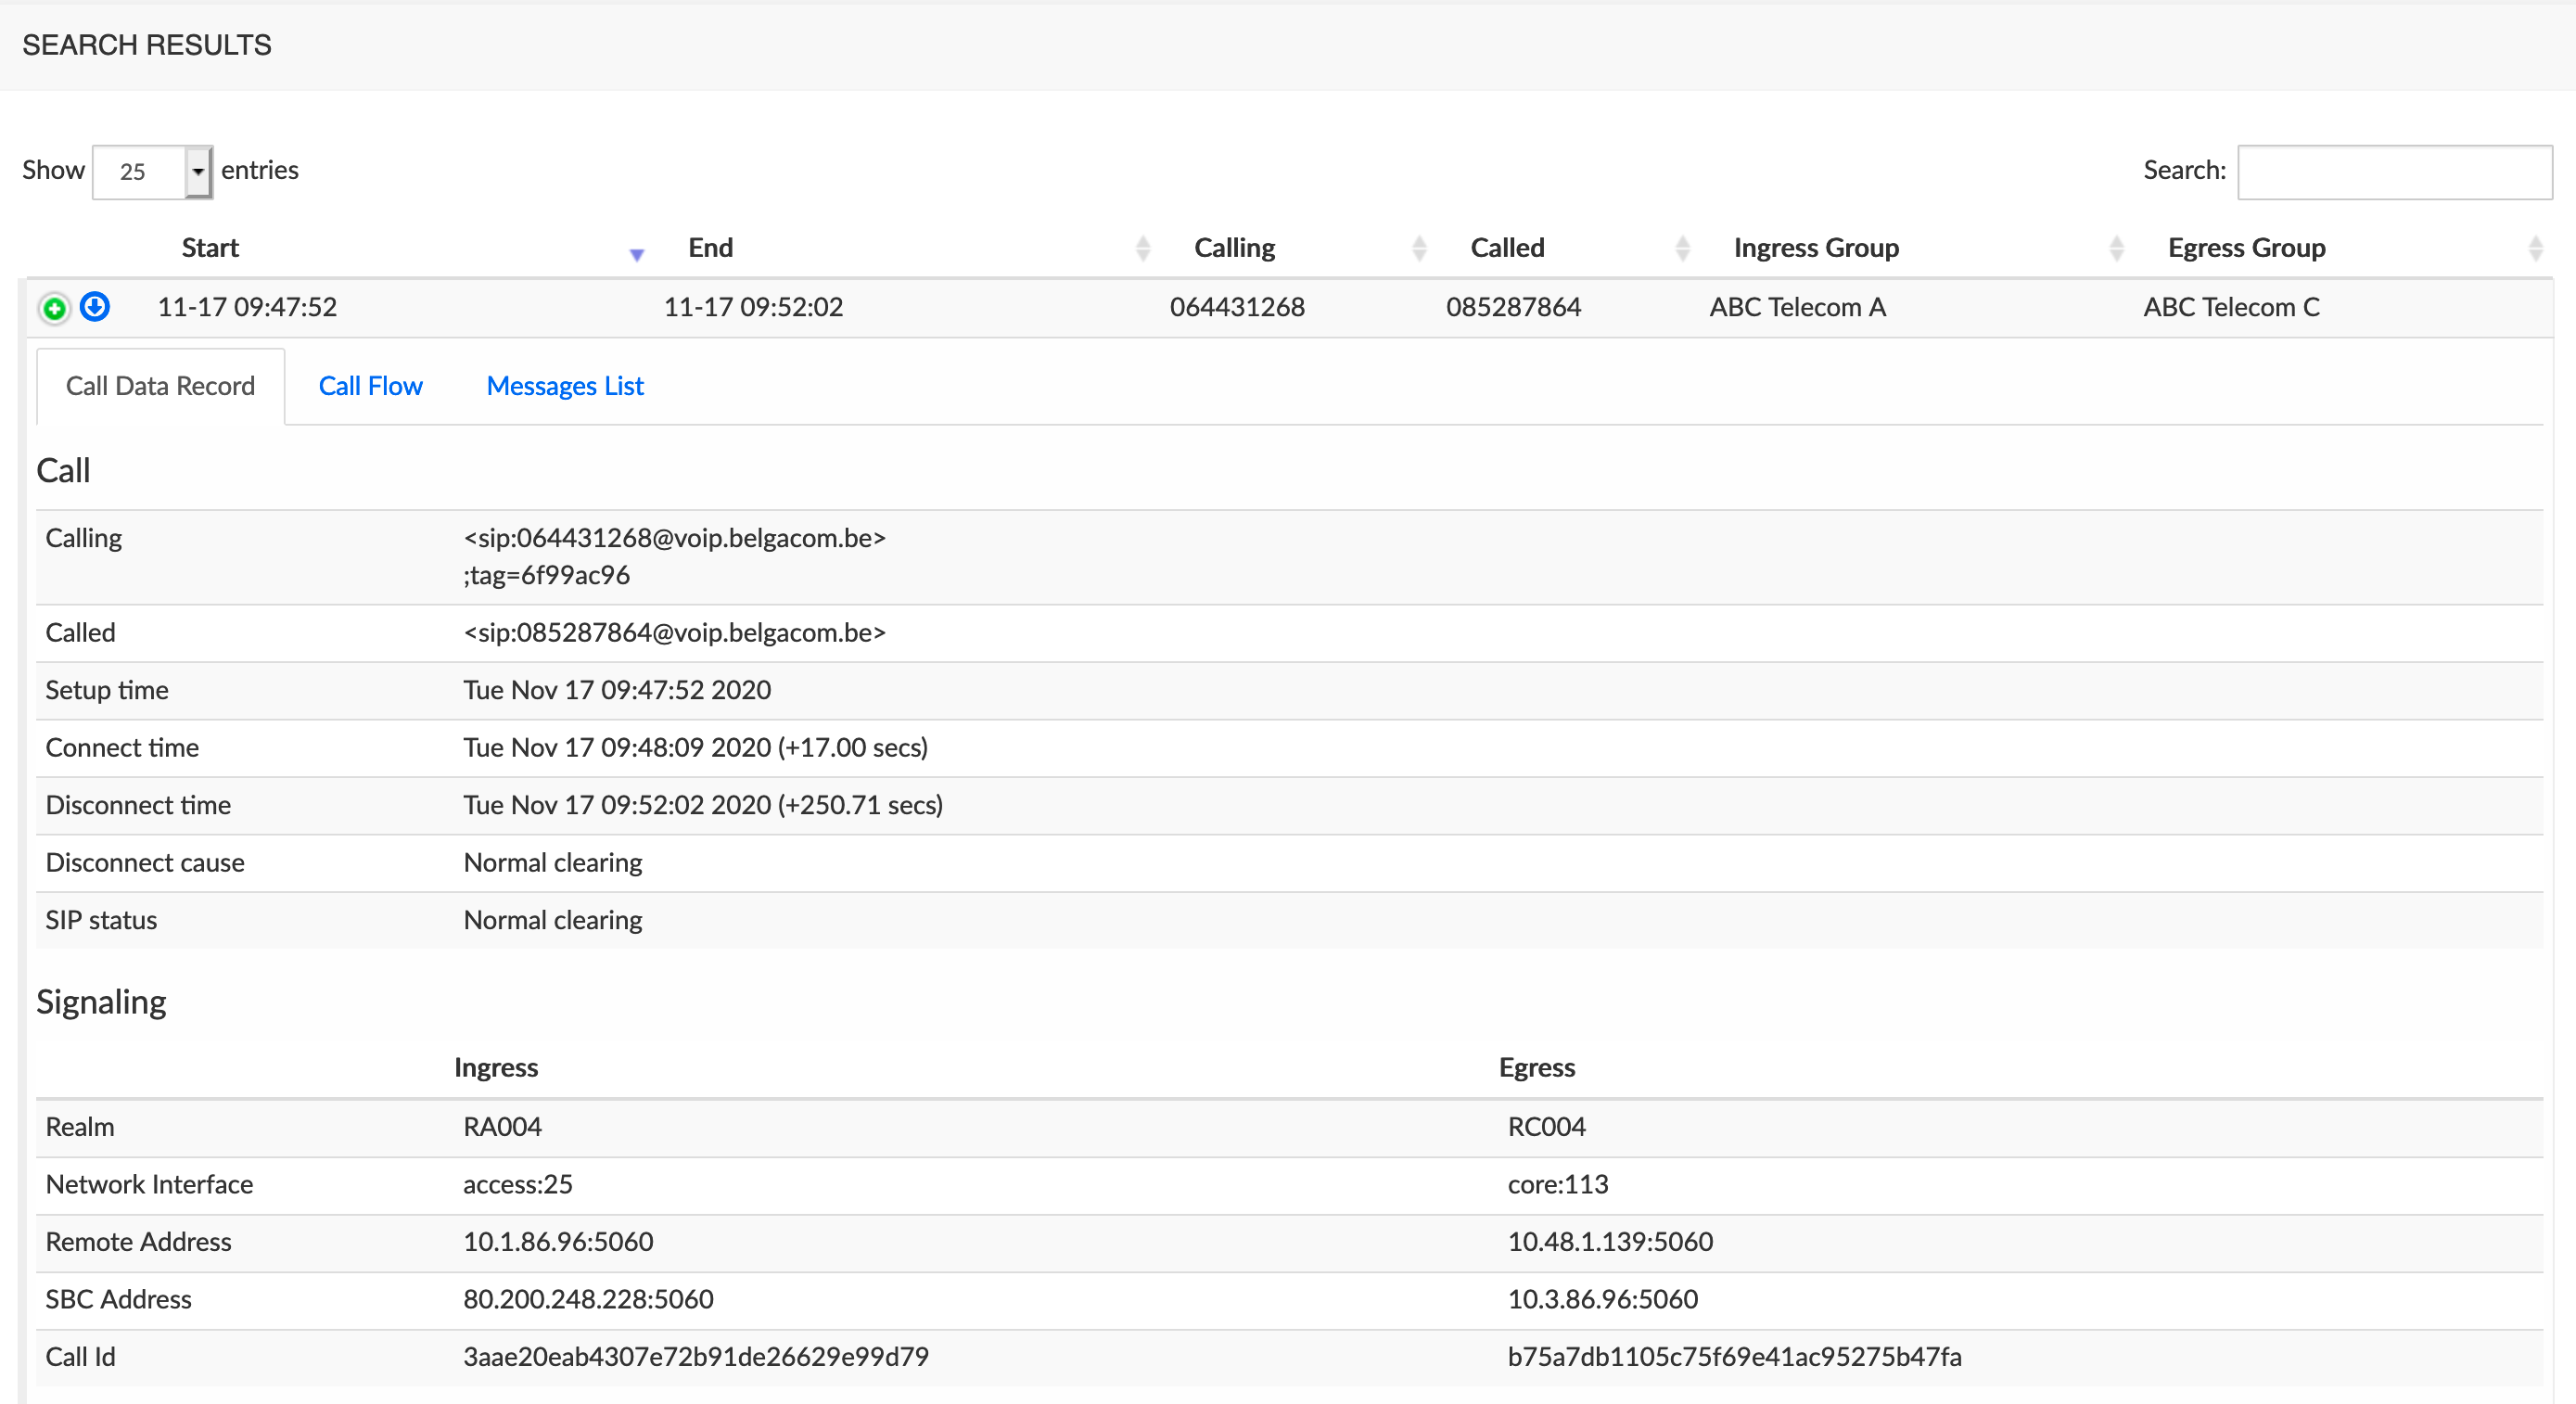
In the Search Results window, click the icon of a call to expand the call details. This action provides details about the selected call, as illustrated below.
More than one call can be inspected at the same time: clicking another icon does not close the first opened one.
Displayed results may differ from the examples below, depending on the equipment, call type, etc.
The picture below shows a Call Details page for Capture:
The picture below shows a Call Details page for NetnetSD:
Call Data Record Tab
This tab displays the data available in the CDR(s) related with the selected call (see [Call data and Trace data -- Understanding the differences] for more details). This content depends on the plugin activated. Refer to the chapter [Plugins Features List] for an overview of the data provided for a particular plugin.
Call Flow tab (with Capture)
This tab displays the call flow diagram.
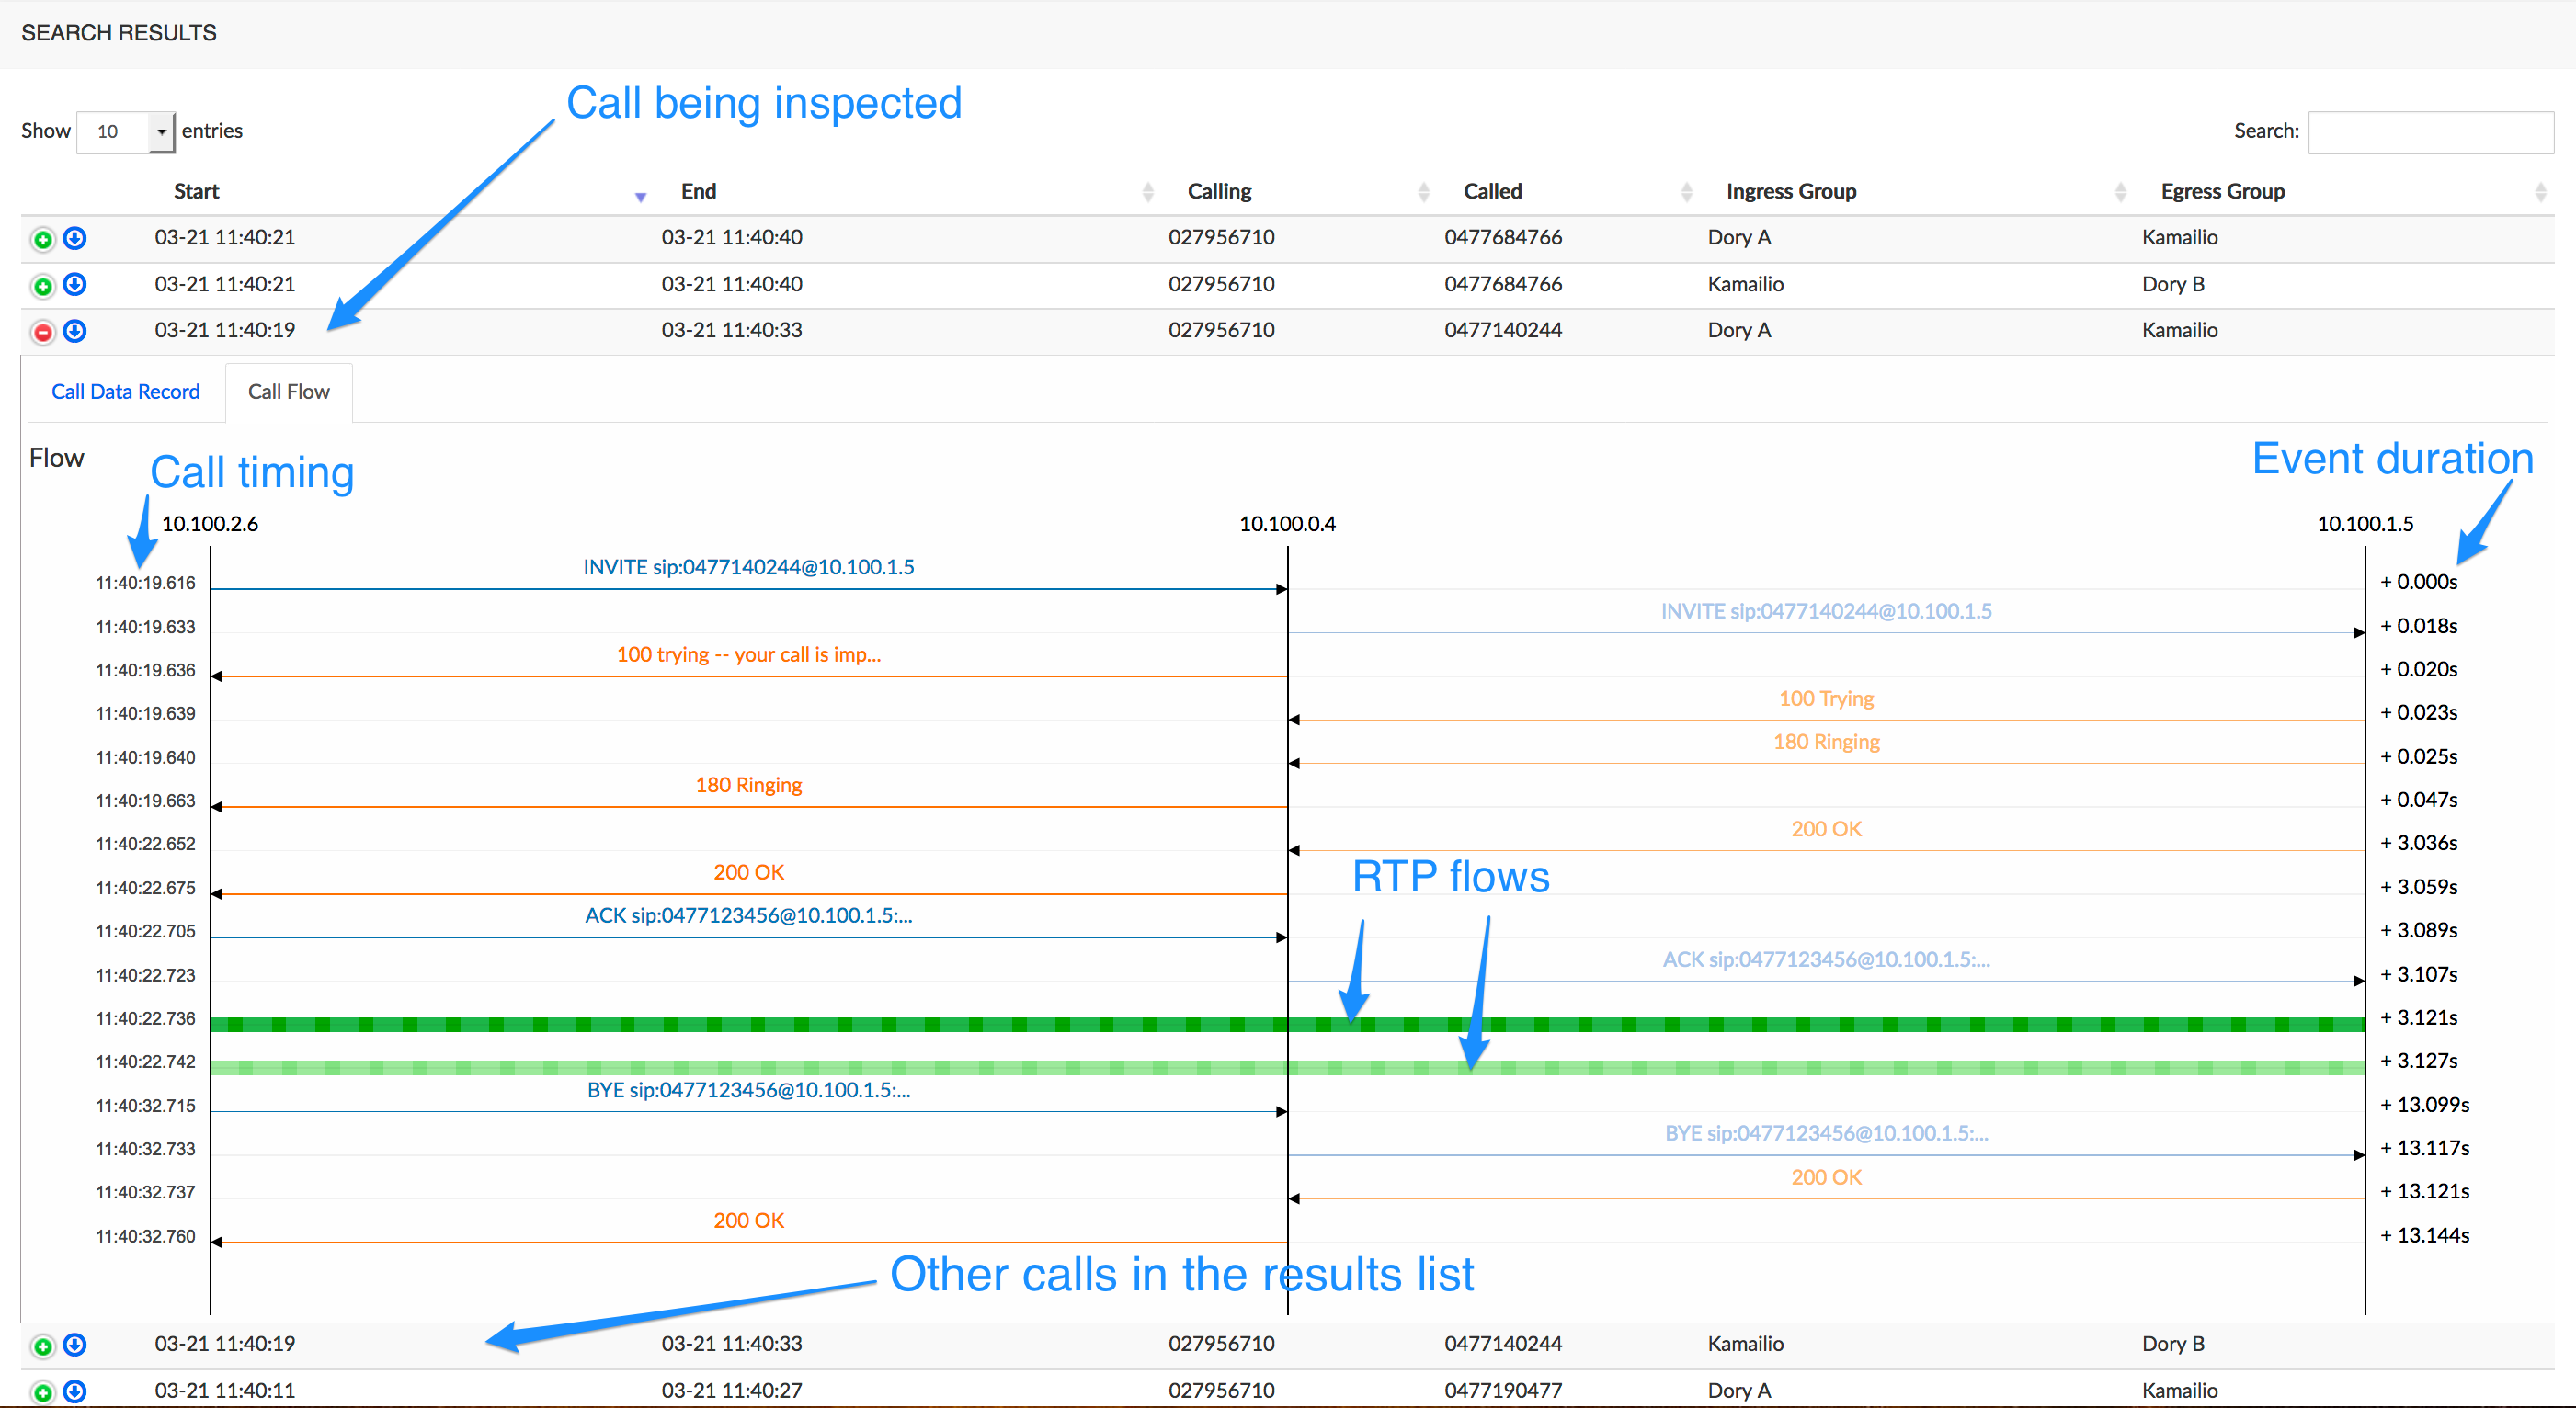
The animated RTP flow lines show the direction of the RTP stream, and allow replaying the audio data. Click the animated line to display the call flow details and audio player, and click again the line to close it.
Call flow details
NEMO probes can be placed at various locations in the network, including at several locations within the same network segment, which allows multi-RTP capture. In this case, more than one RTP capture is shown in the Call flow details window that opens when you click the RTP flow line.
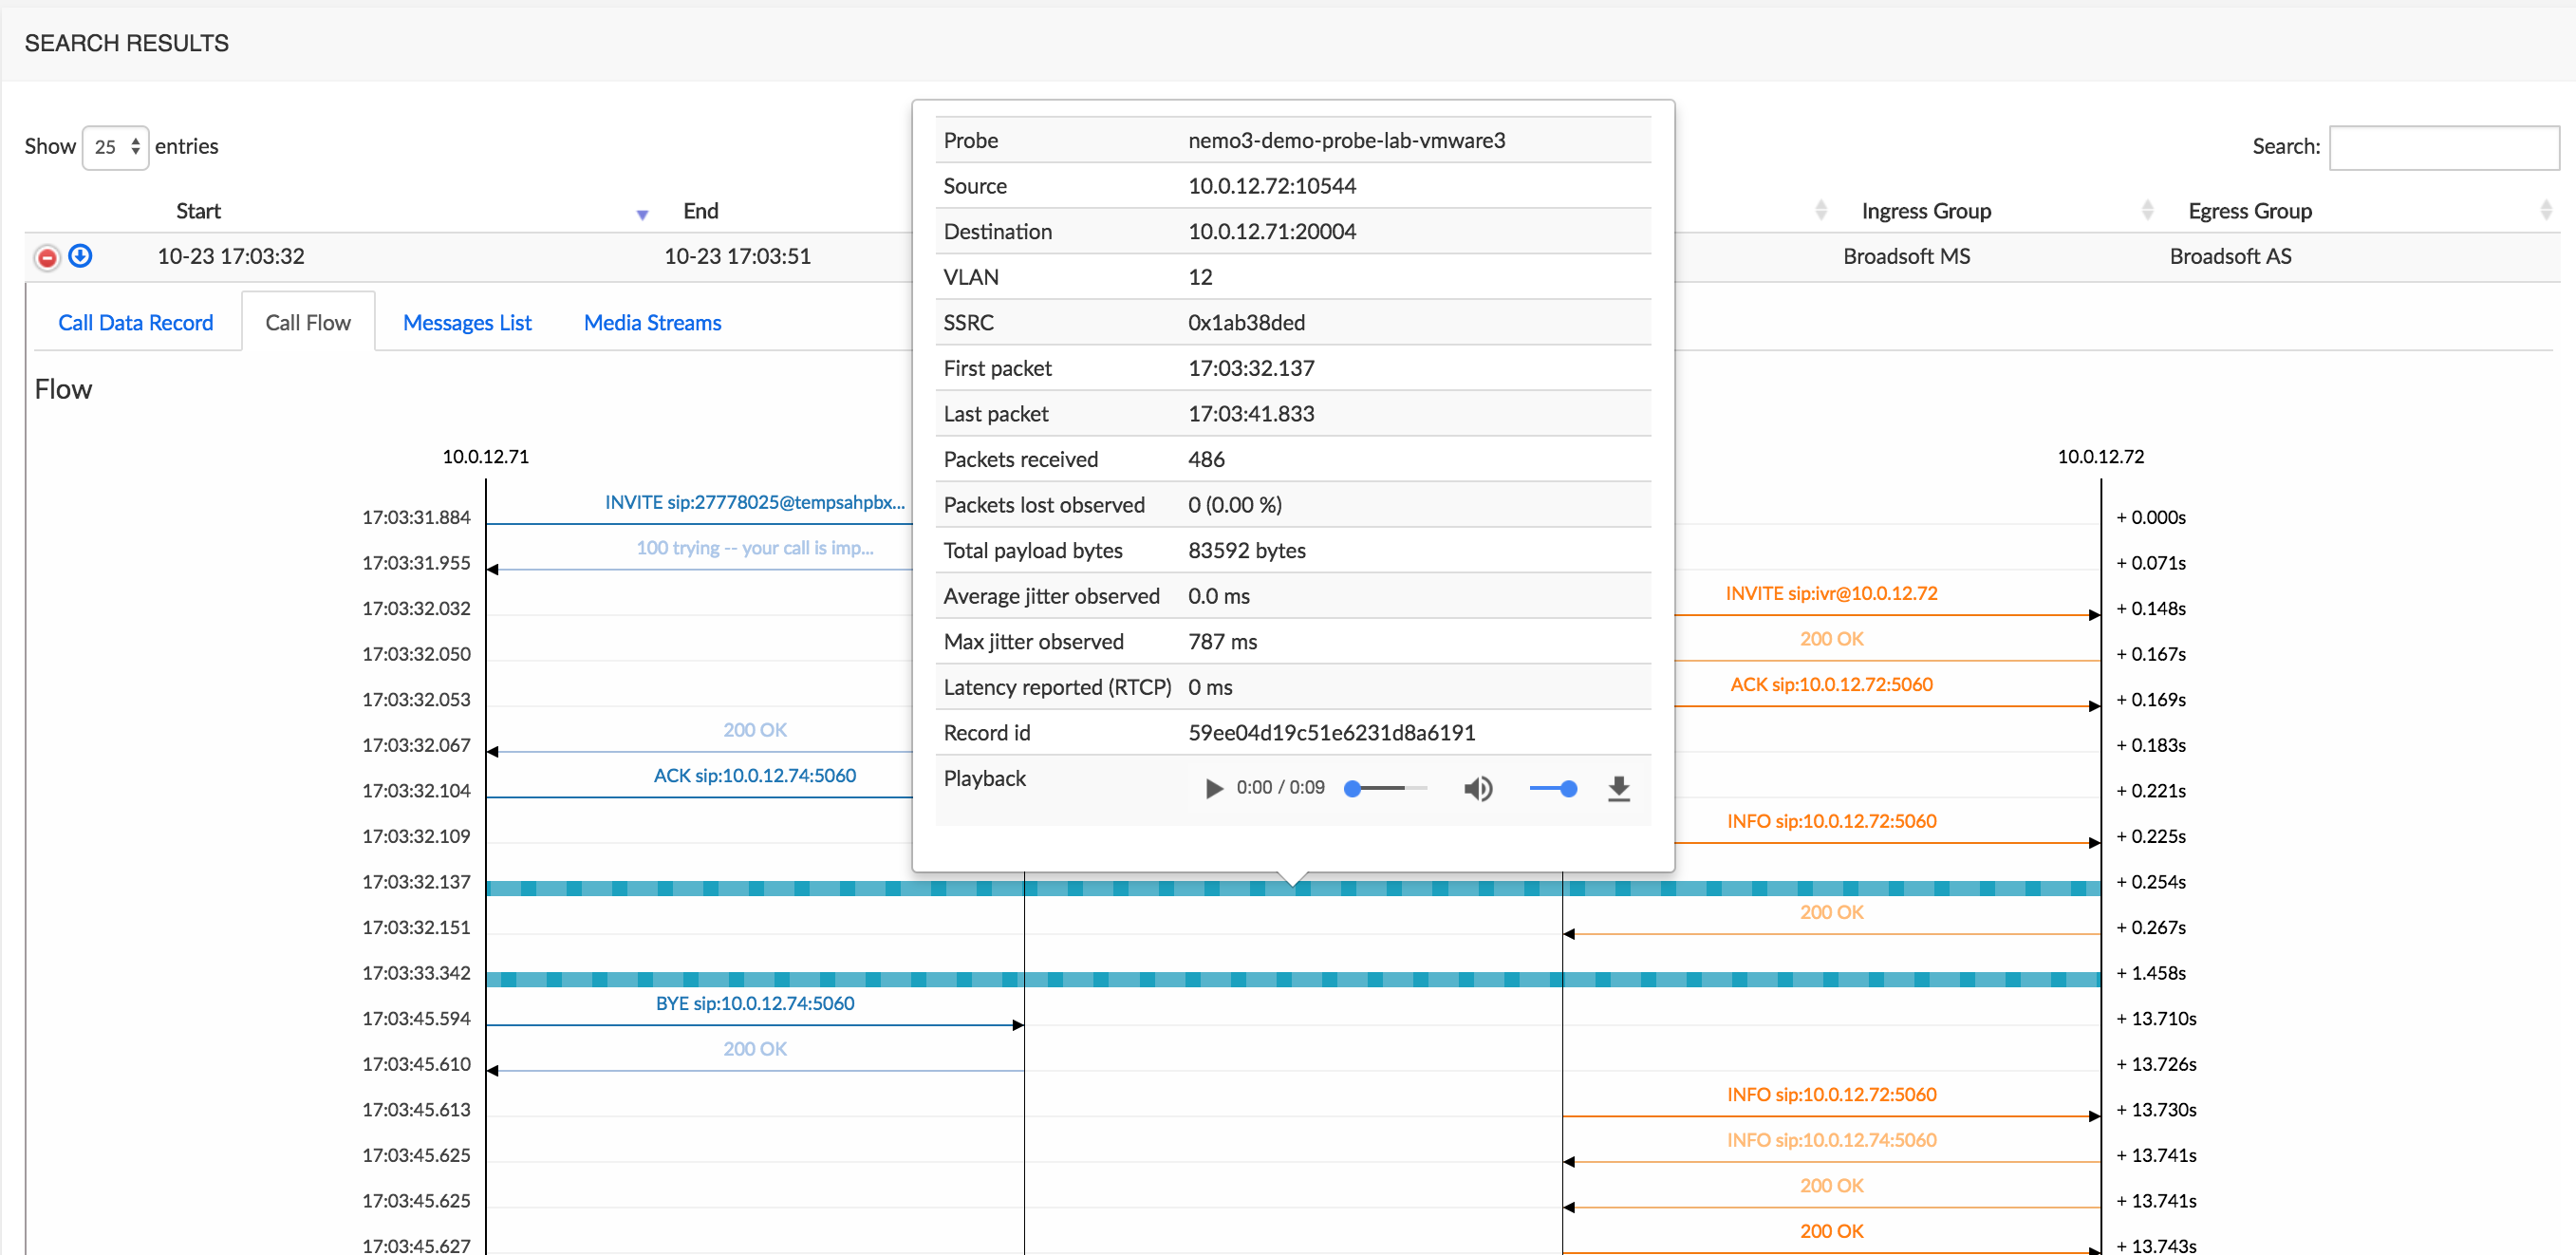
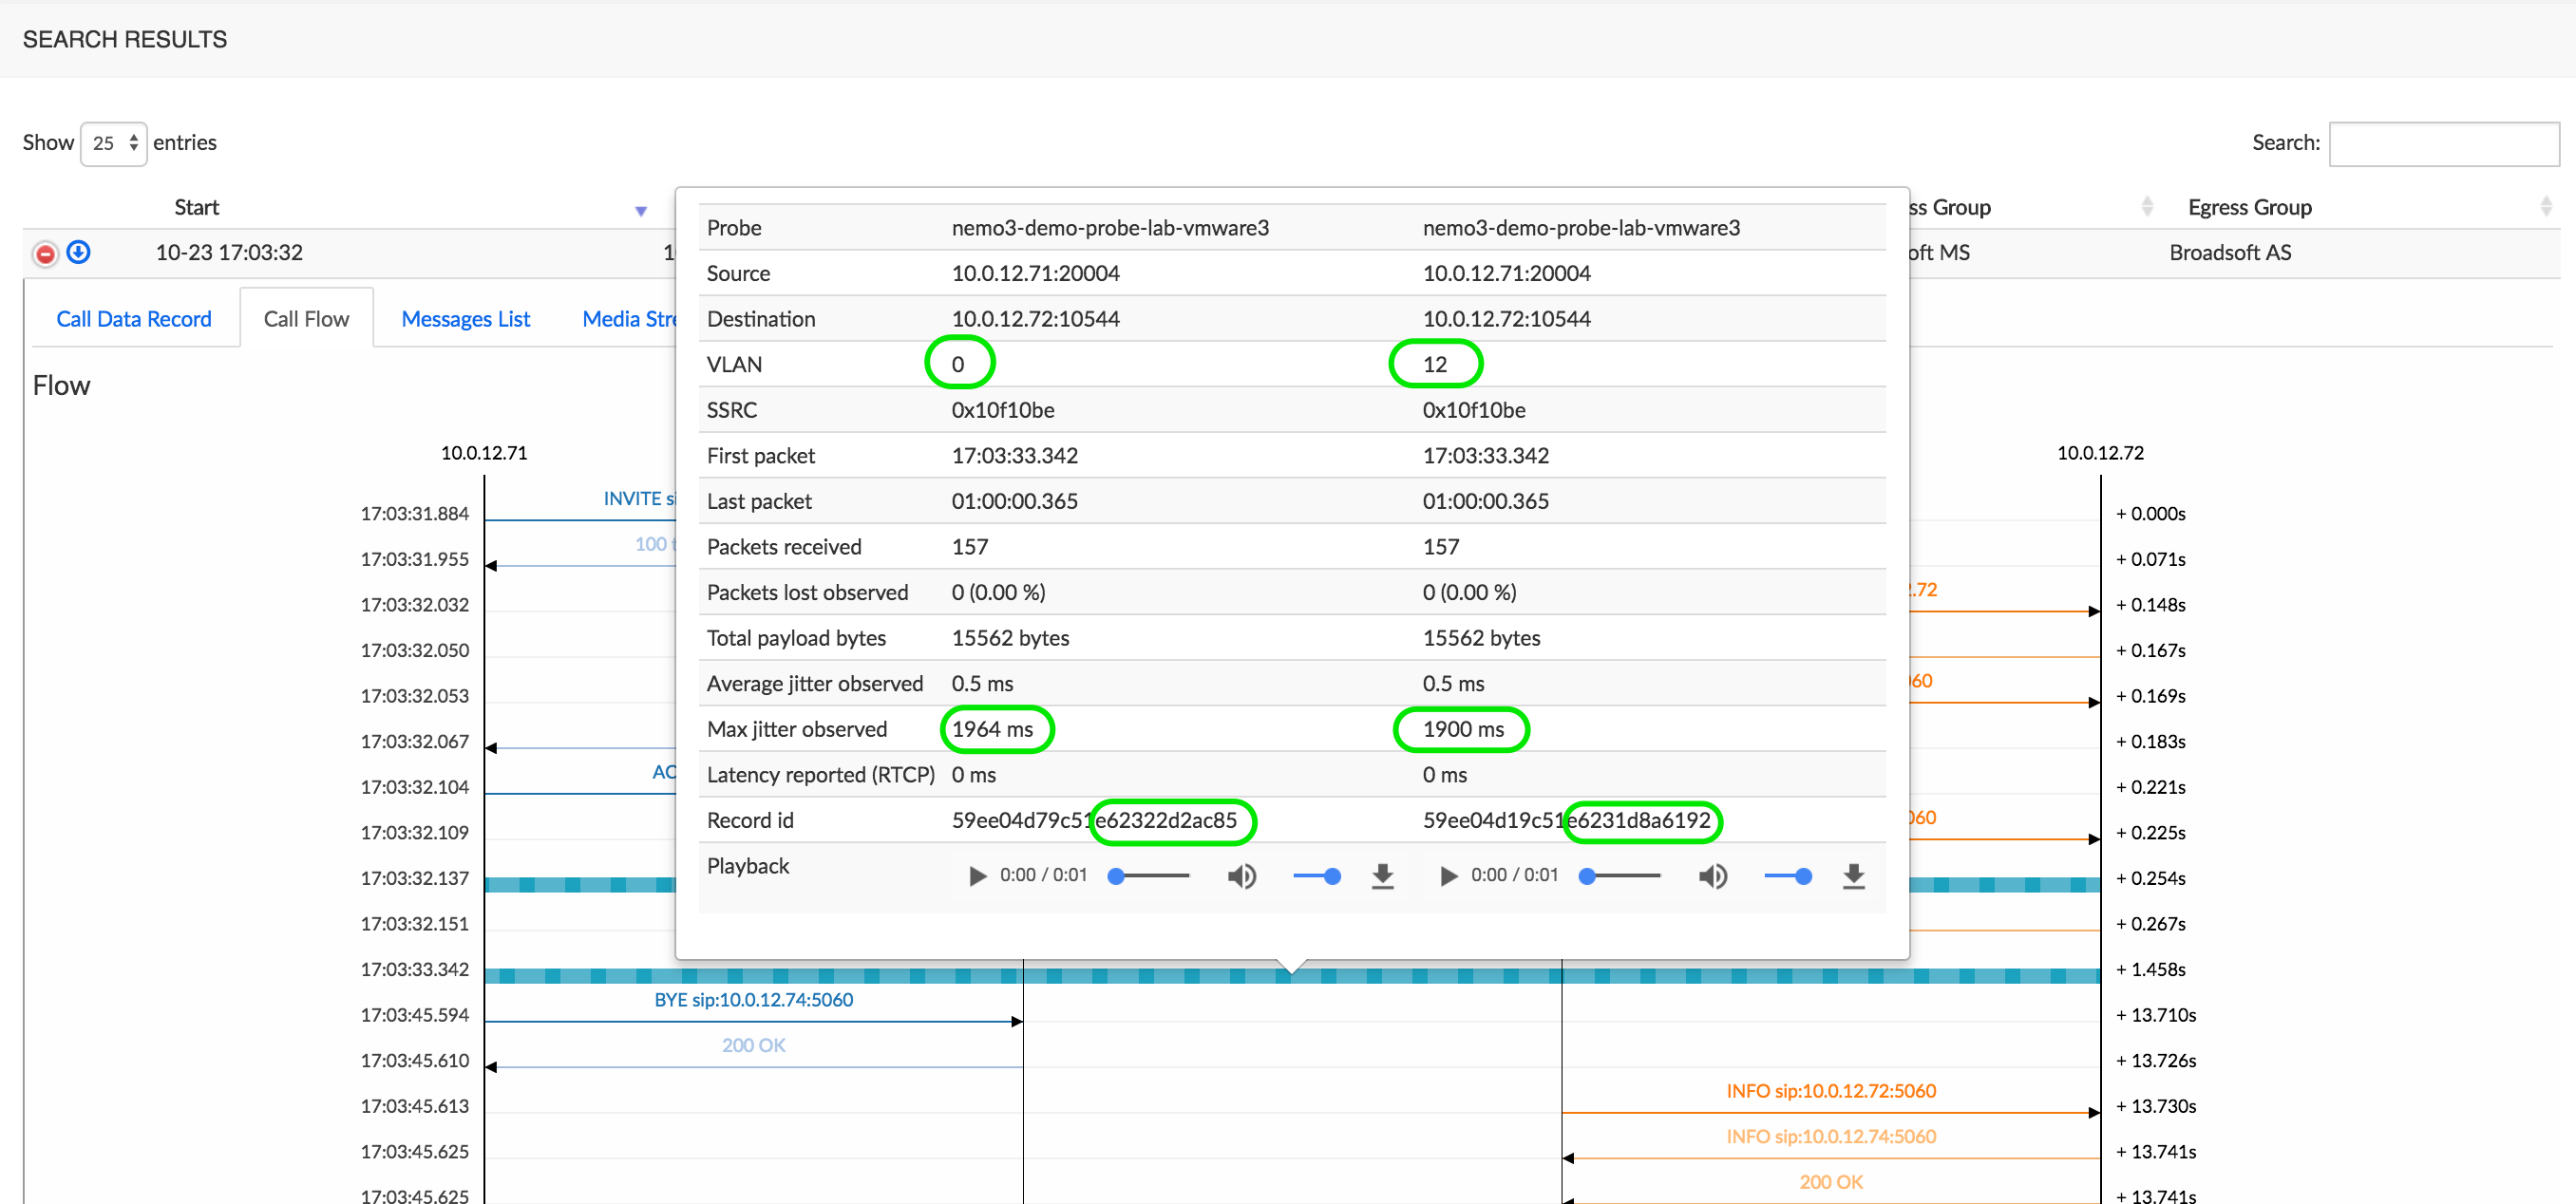
The figure below shows the controls available in the player: Play / Pause key, position being played (0:00), whole duration (0:09), adjustable Volume and Download key. When more than one RTP capture is shown, a second player allows playing back the second stream.

Messages Lists Tab (with Capture)
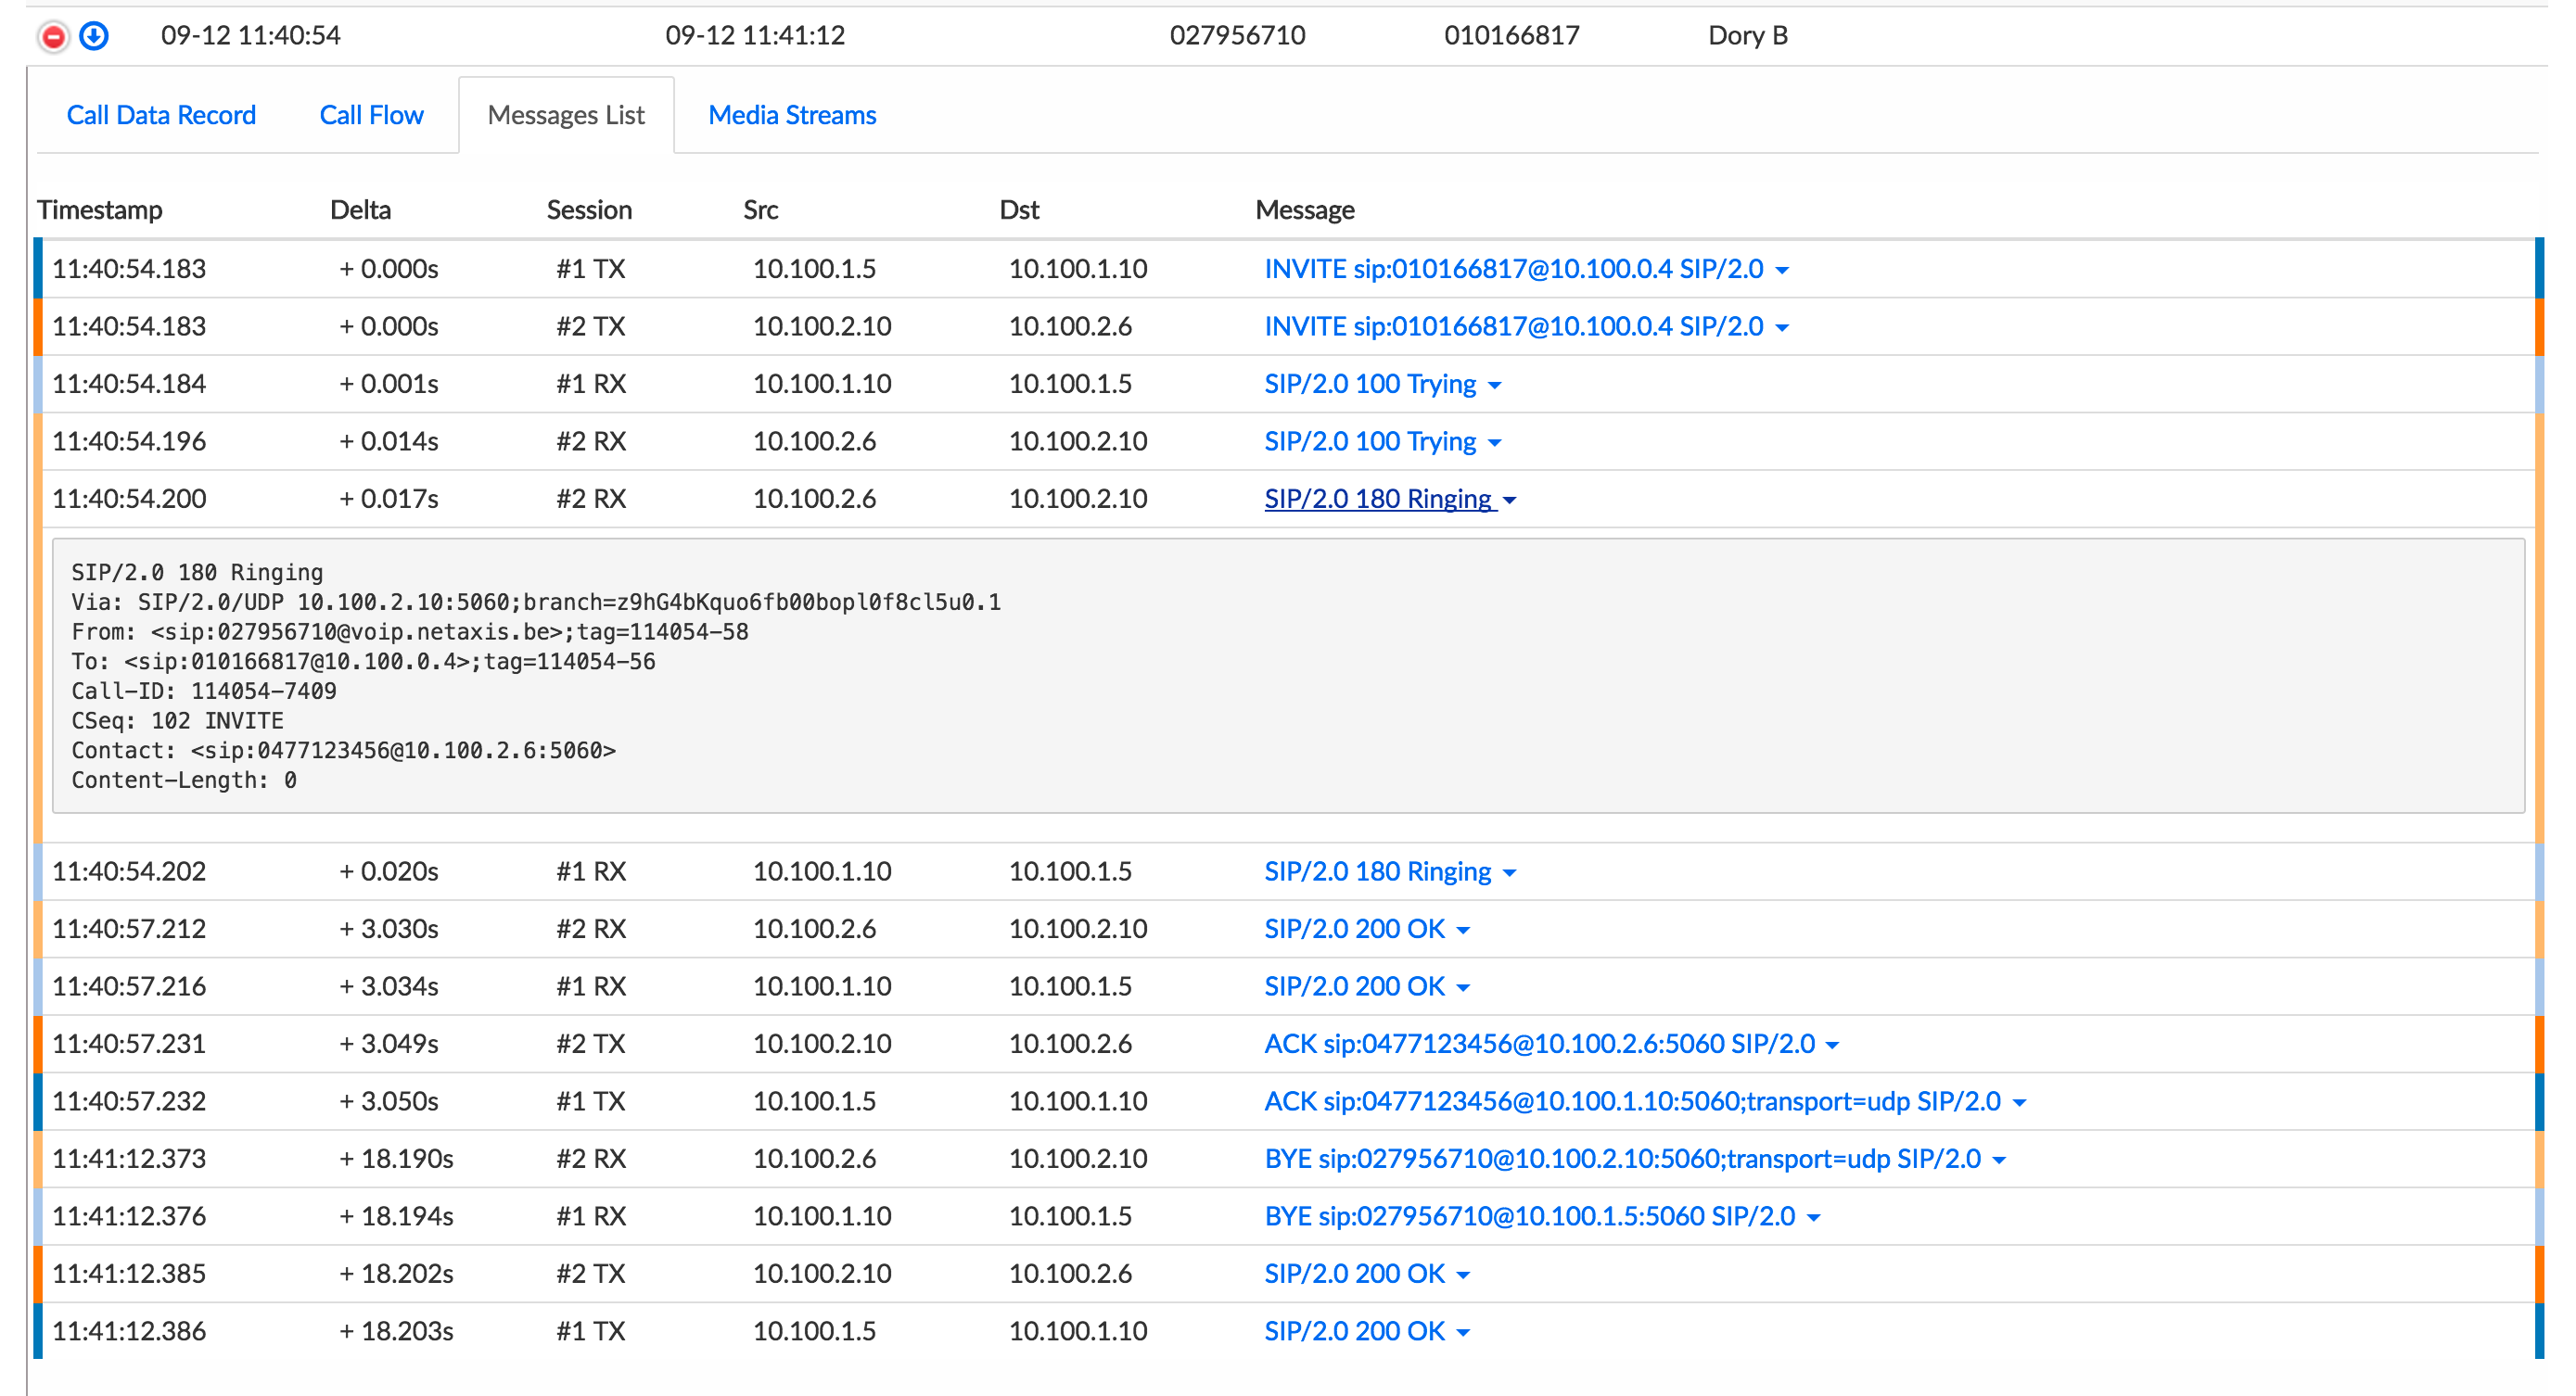
This tab displays the list of SIP messages exchanged for the selected call. Click a message to display (and copy if needed) its SIP details, as illustrated below.
The vertical colored bars on the left help identifying the different call legs.
Media Streams Tab (with Capture)
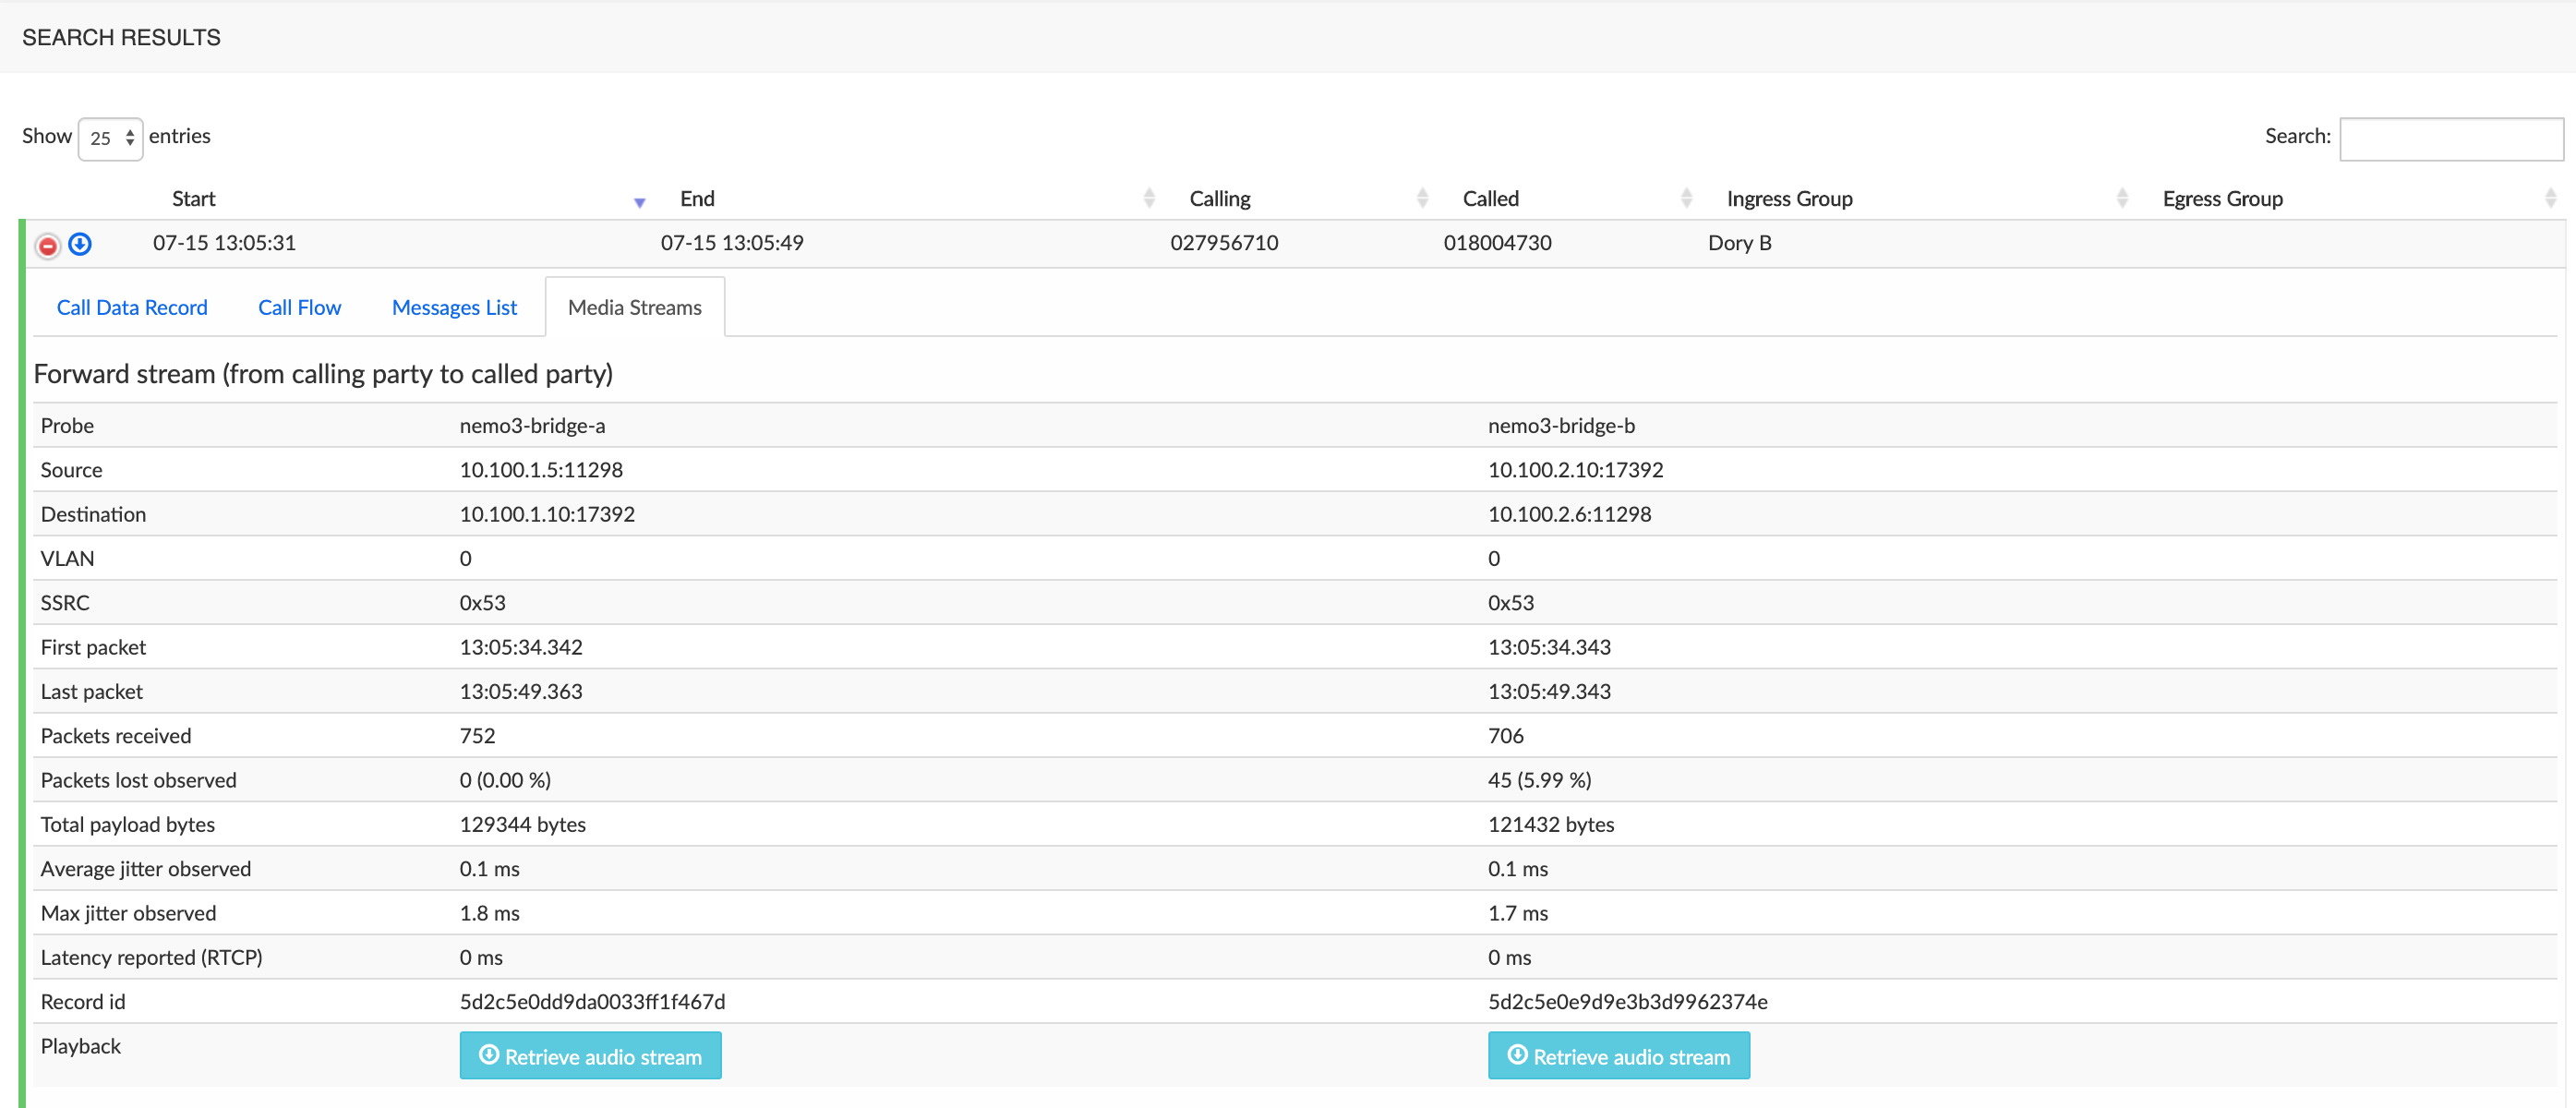
This tab displays the forward and reverse media streams for the selected call, with all details and a playback player. The media file(s) can be downloaded locally (mp3 format). The picture below shows the Forward stream of the expanded call (the Reverse stream, not shown, appears below).
WARNING
If you can't see Playback - Retrieve audio stream control as last item of the Stream details list, your user account has not been granted the corresponding access privilege. This is due to the enforcement of GDPR rules in NEMO.
If you are entitled to retrieve (playback and download) audio files, ask your NEMO administrator to grant you this access via Settings > Users > Edit Users > Access Privileges, as shown below.
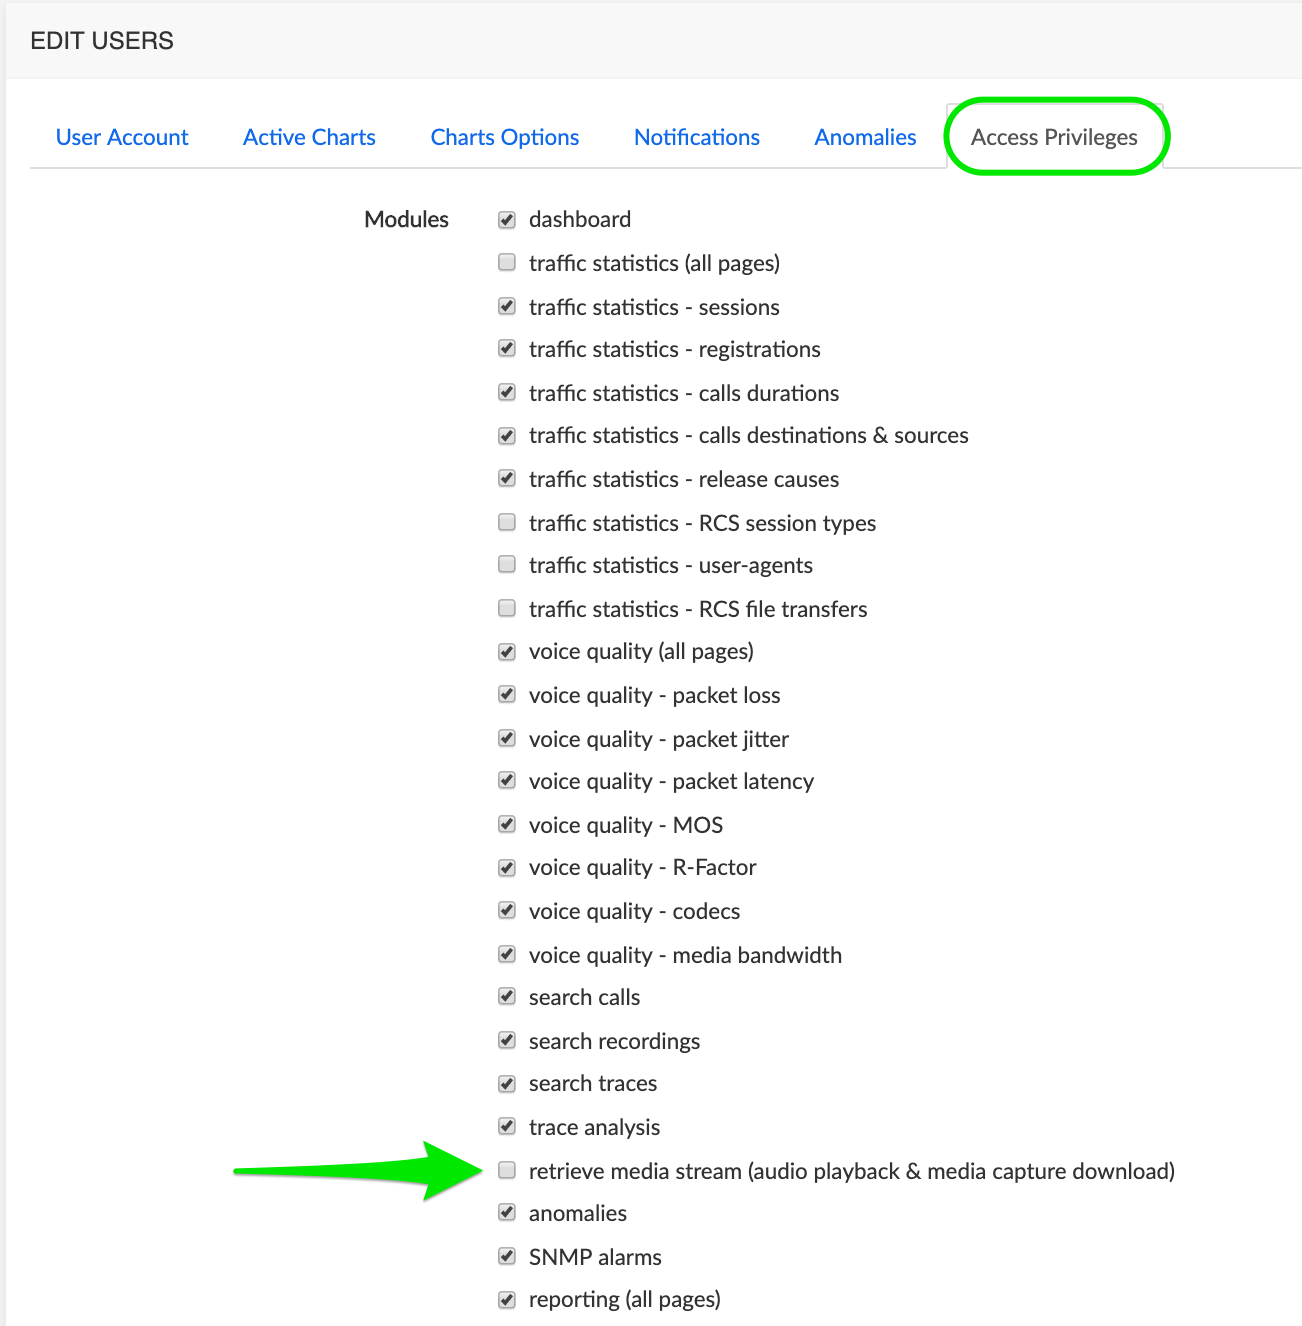
Once the control is visible, click it to display the audio player.

INFO
Some browsers allow downloading the media as MP3.
Registrations Tab
This tab is only shown for calls of REGISTER type.
In the Search Calls screen, select from the Columns drop-down list the value « SIP Method », set a time range and click Search.
The Search Results screen shows the calls within the time range, with the indication of the SIP Method used. In the picture below, the calls with SIP Method circled in green will show the Registrations tab when expanded ; those circled in red (not: REGISTER) will not show this tab. You may want to type « Register » in the Search field at the top right to filter the result list to REGISTER type calls only.
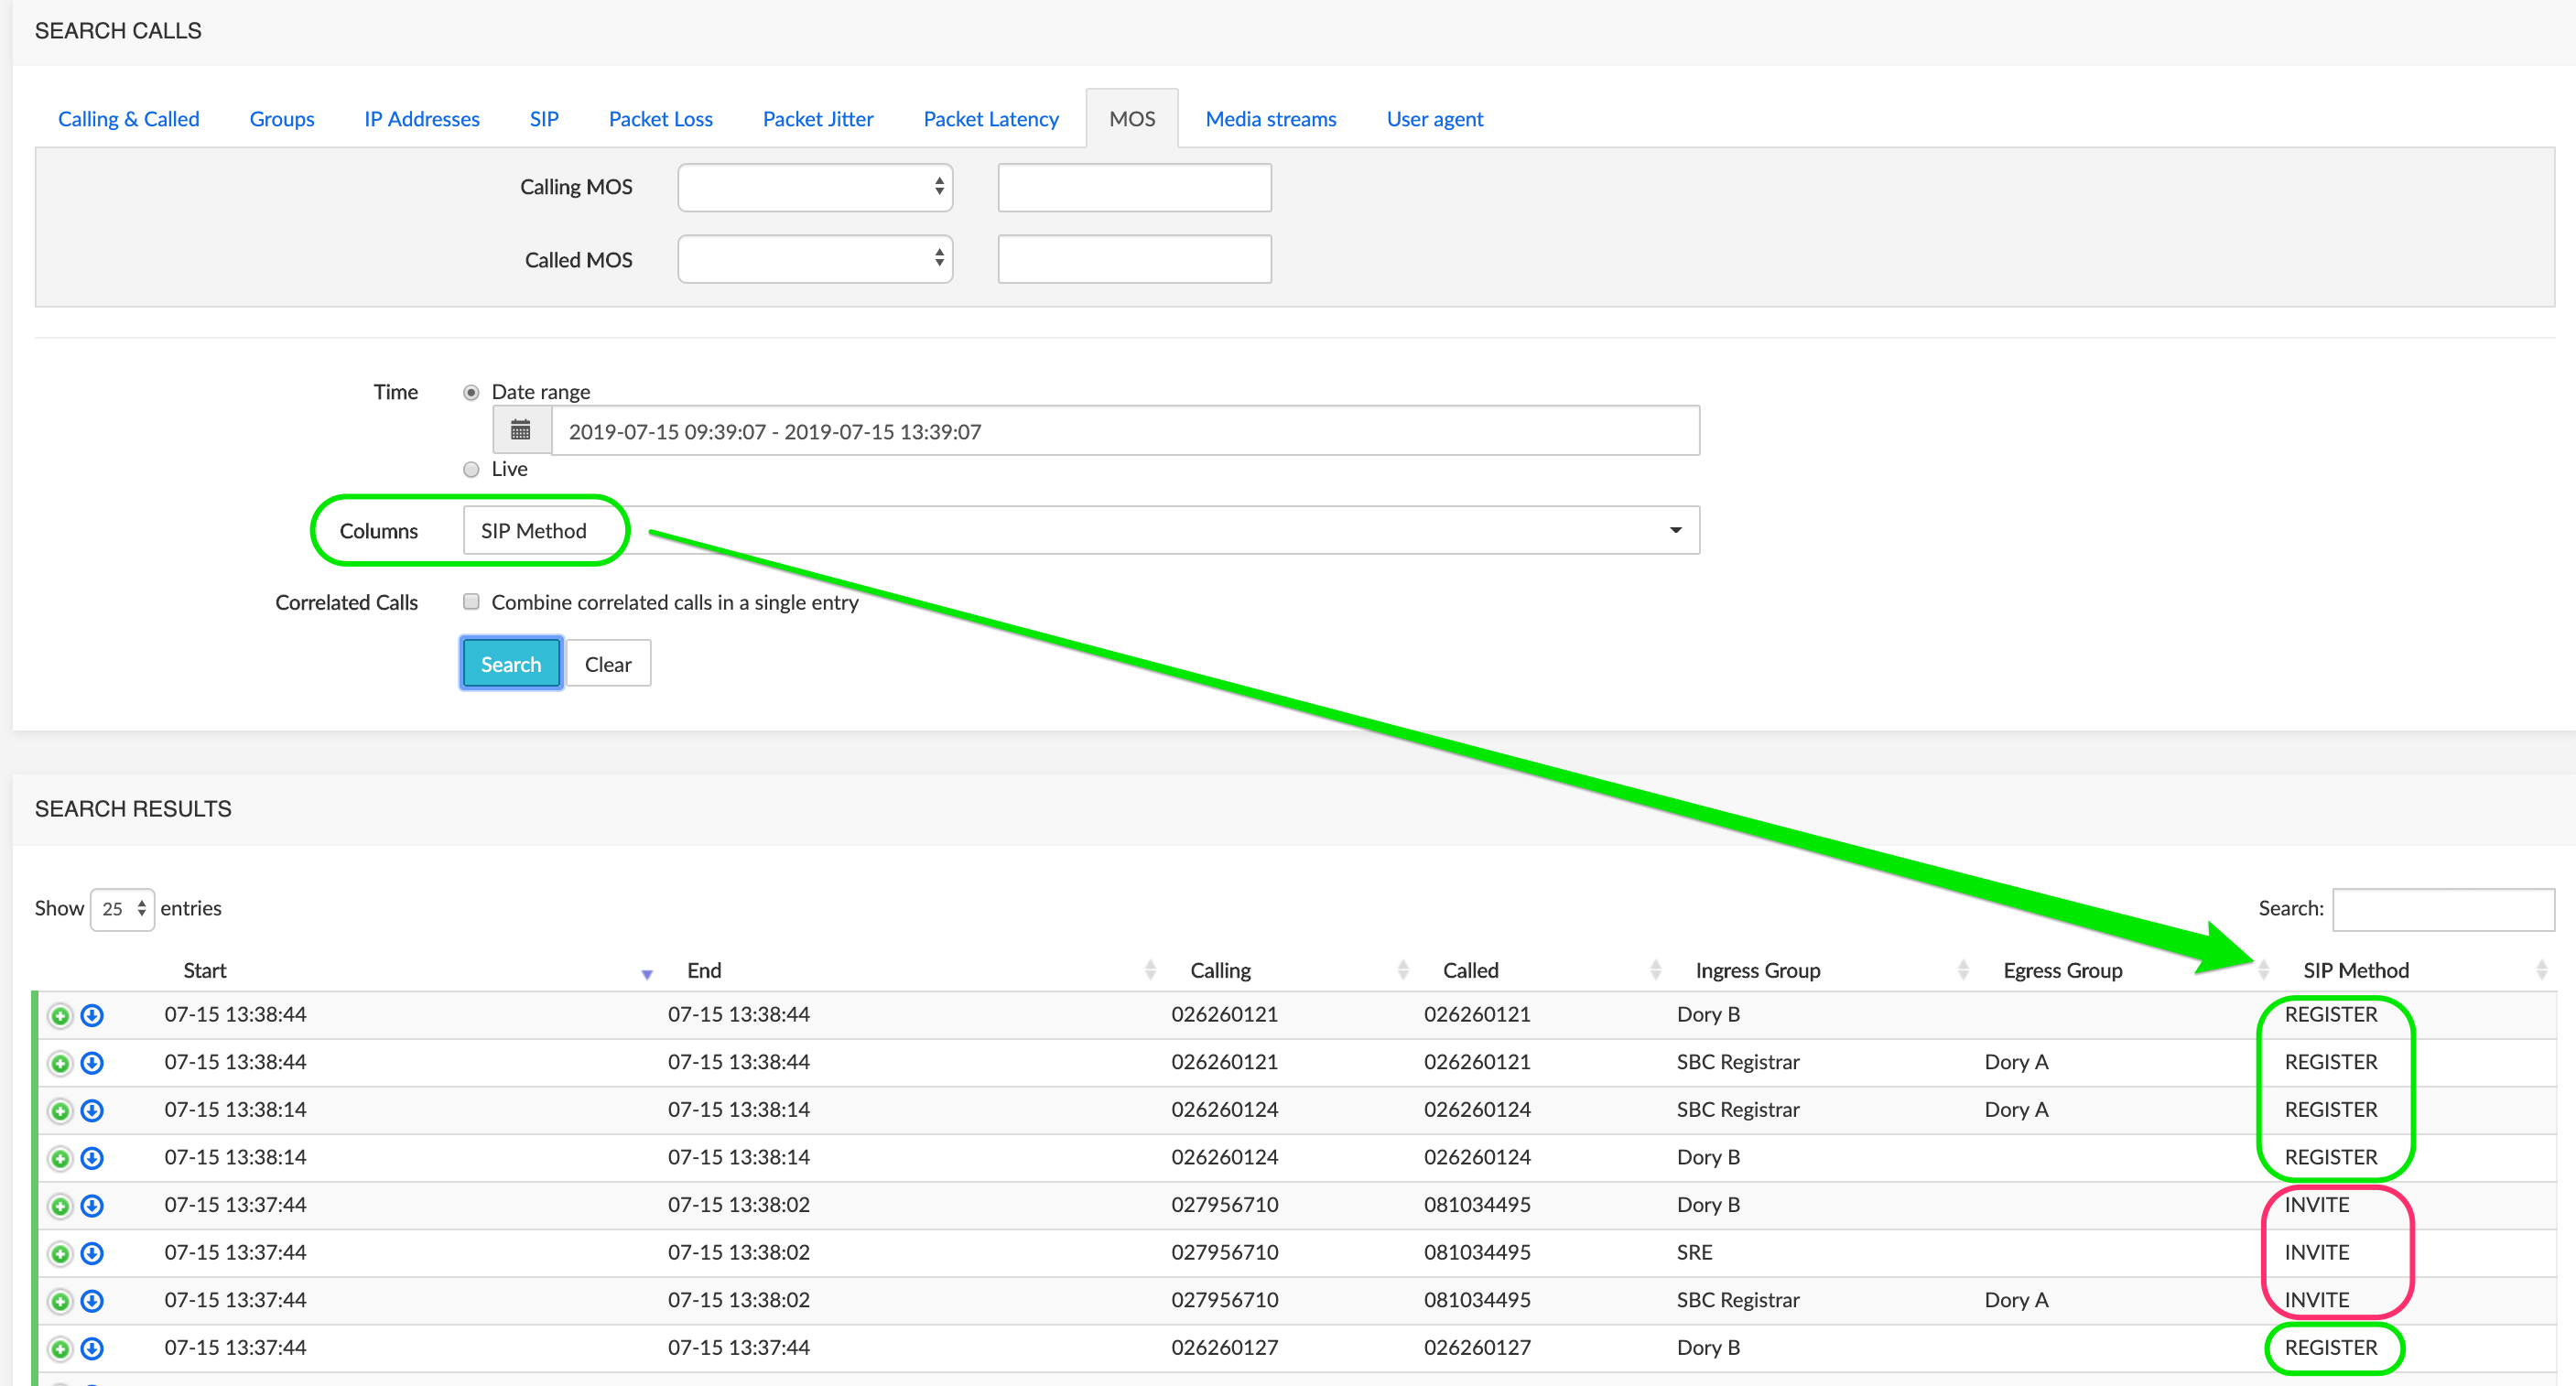
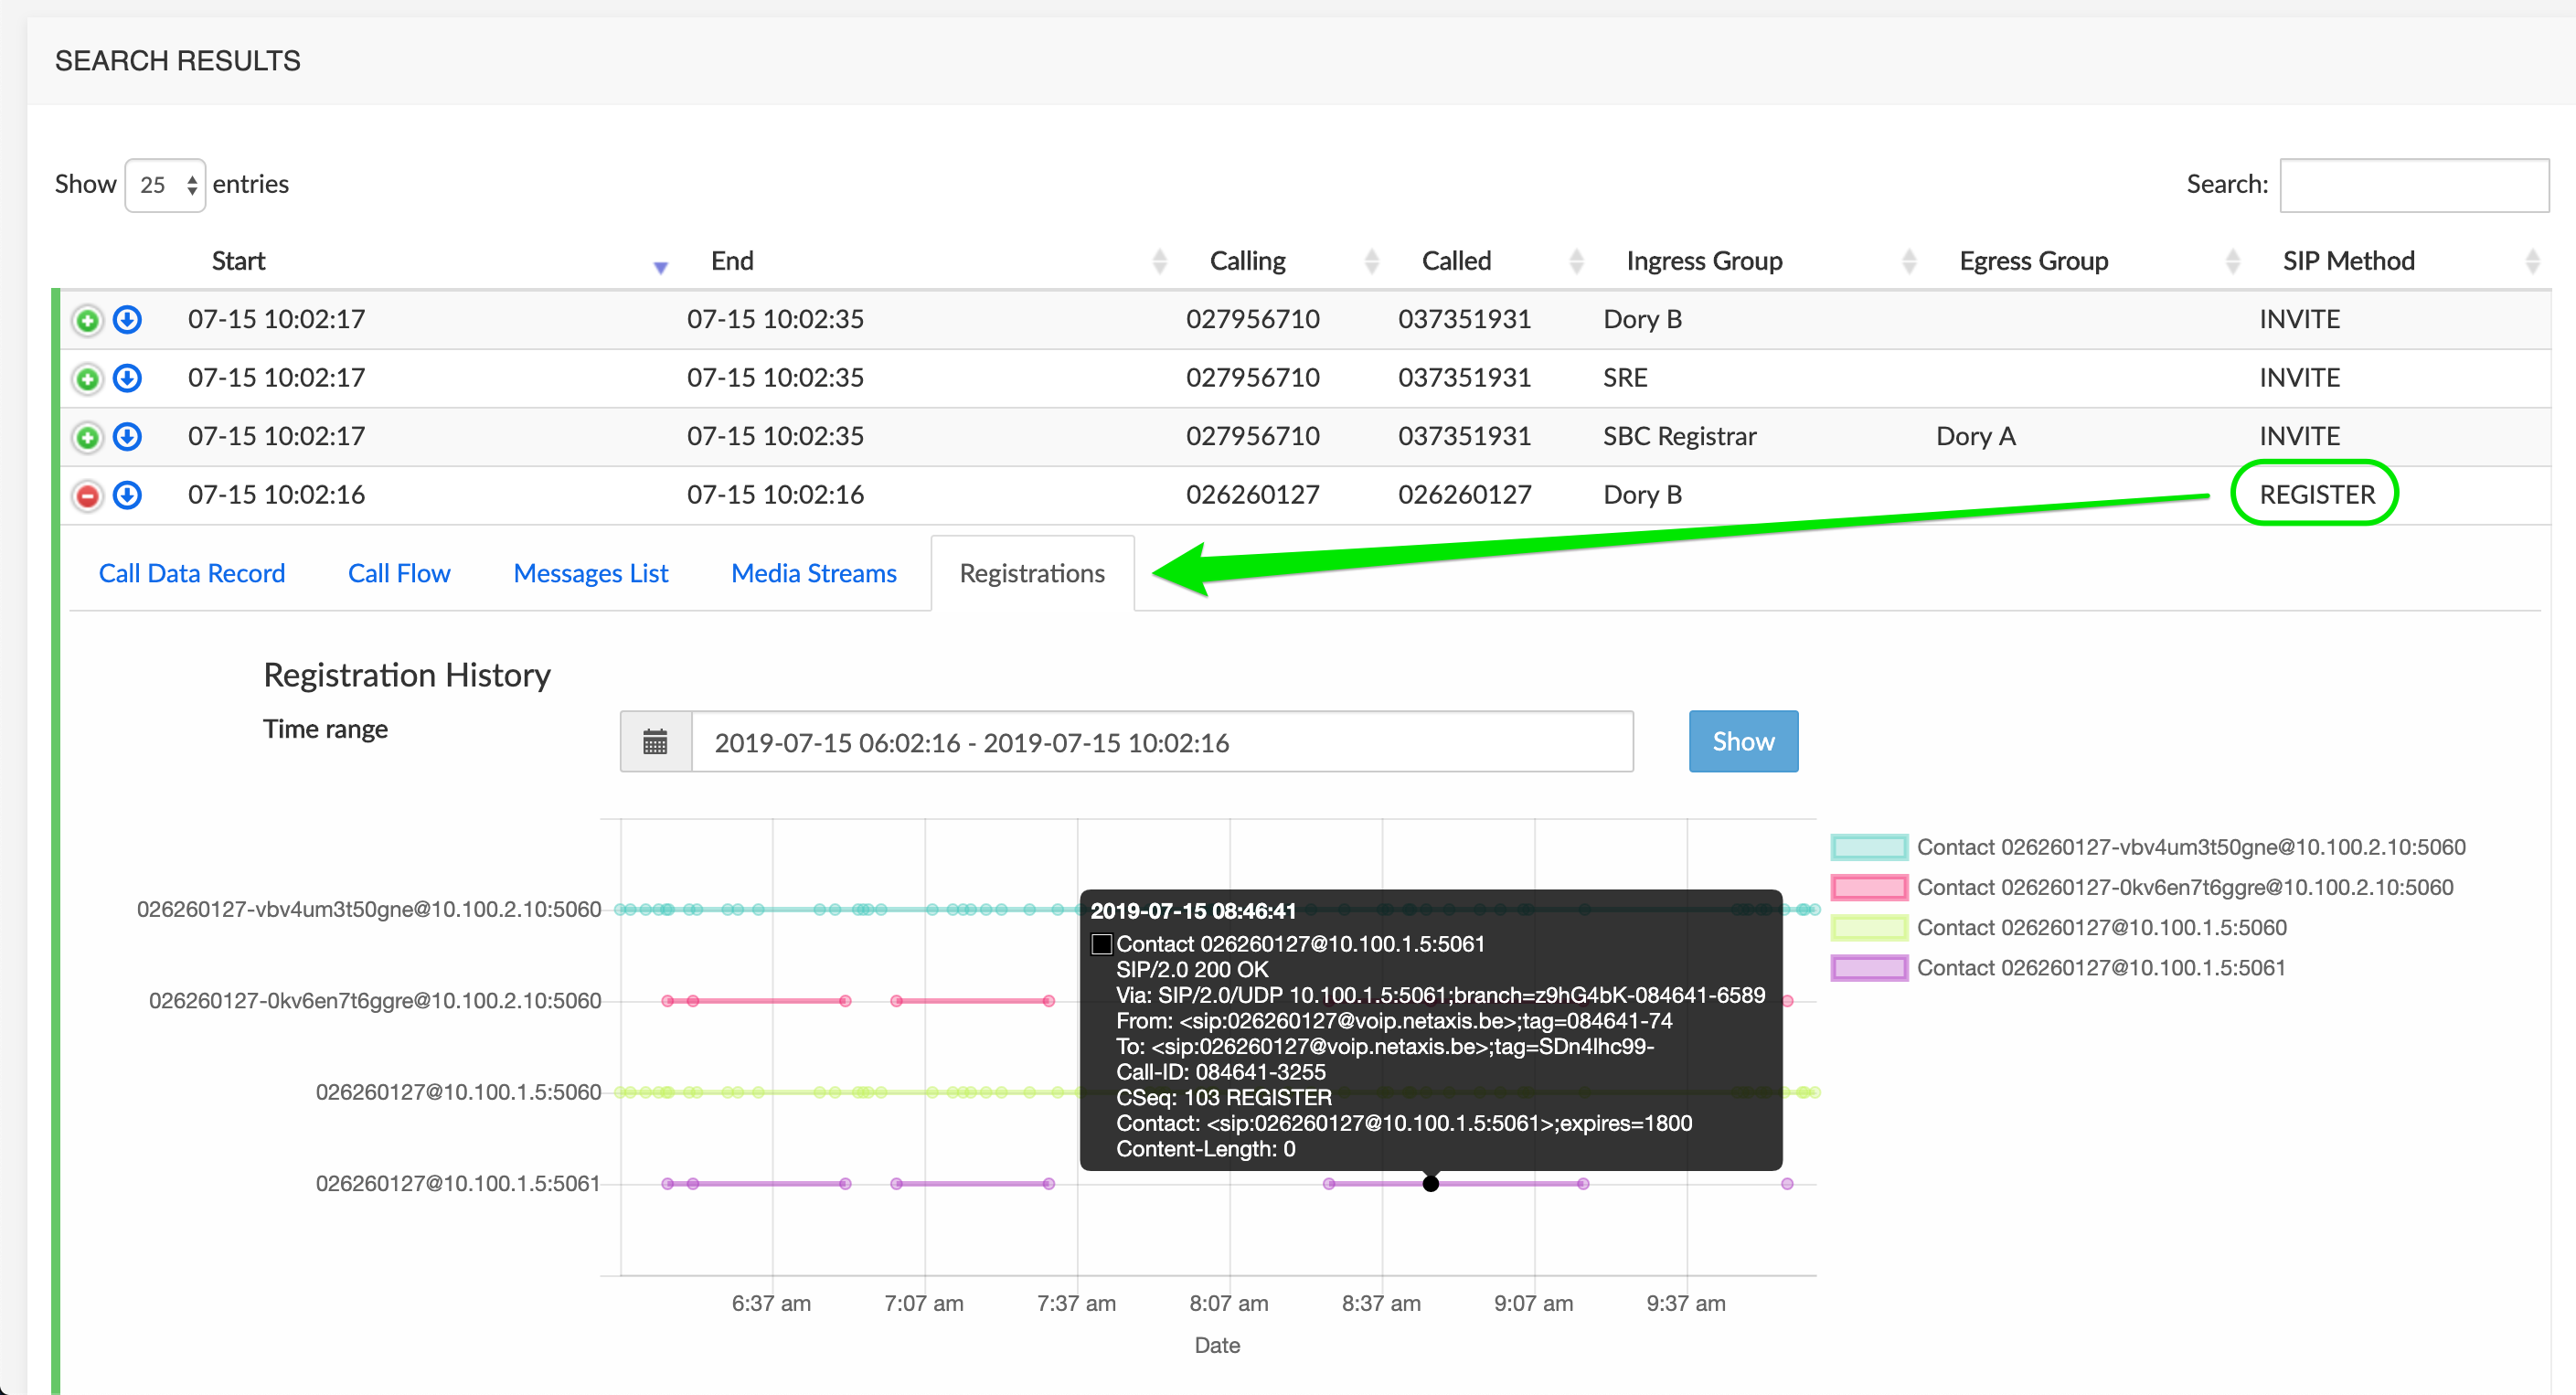
When expanded, a REGISTER type call will show the Registrations tab. Select a time range then click Show to display the graph.
Mouse over any spot in the graph shows the call details (white on black display below).
Export Calls
The Export Calls button at the bottom of the Search Results browser page allows exporting the search results to a .csv file. This .csv file contains the same columns as the columns displayed in the search results browser.
Download Trace
In the Search Results list, click the icon of a call to download the call flow trace for further inspection using the Trace Analysis tool.
You can open the file using an external application or save the file, then submit it back to NEMO for further analysis. See [Trace Analysis] below for more details.
Search Traces
When probes are present and Tracing has been activated (see [Tracing]), the Search Traces command allows selecting and viewing traces captured by the probes.
The Search Traces selection window, illustrated below, allows setting criteria to filter the traces.
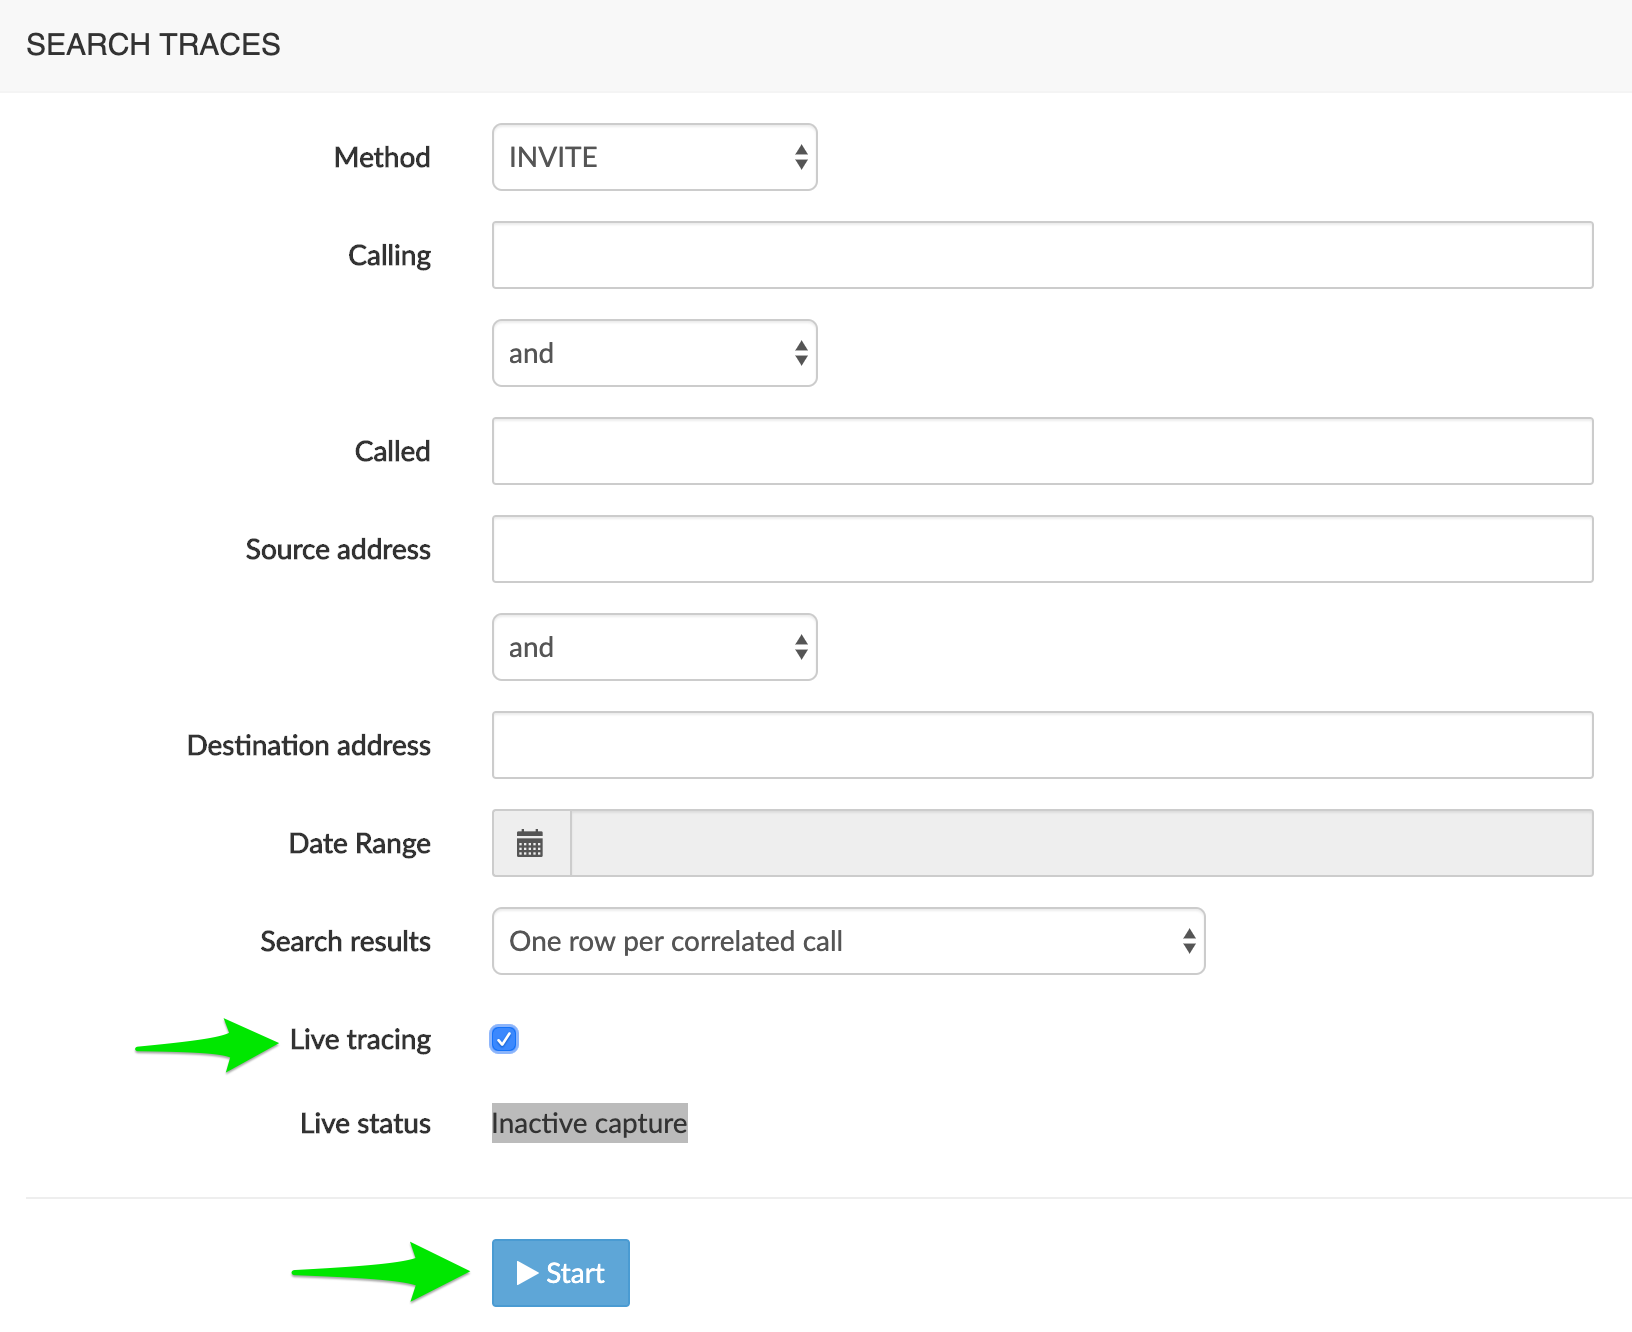
The Method drop-down list allows specifying one SIP method from the list: INVITE, NOTIFY, REGISTER, OPTIONS, SUBSCRIBE.
The Calling and Called text boxes allow specifying criteria for the calling and/or called party numbers. The search results will return all calls from and/or to the numbers starting with the digits specified in the Calling and/or Called criteria.
The Source address and Destination address text boxes allows specifying the IP address for the source and/or destination endpoint(s). IPv6 format is supported.
The Date Range drop-down box allows specifying the time range using the following criteria:
- Last Hour
- Last 4 Hours
- Last 12 Hours
- Last 24 Hours
- Today (all calls from today 00:00 until 23:59).
- Yesterday (all calls from yesterday 00:00 until yesterday 23:59).
- Last 7 days
- Custom Range (allows defining a customized range)
The Search Results drop-down list allows aggregating the flow of each leg in a call into one single row ("one row per correlated call") or having each leg's flow available separately ("one row per individual call leg").
The Live tracing checkbox activates the live capture mode. The Search button becomes Start. Click it to launch the live capture; when started, click it again (Stop) to stop the capture.
The Live status zone displays a message indicating the status of the live capture. Reported status can be:
Grey : "Inactive capture"
No active request at GUI level.
Orange/Red: "Inactive capture"
Active request at GUI level, but unknown at probe level.
Red : "Unknown capture status"
Active request at GUI level, but status cannot be collected due to a communication issue.
Yellow: "Updating captured calls only"
Active request, but new calls are not monitored, only the captured calls are updated. A limit (time limit or maximum number of captured calls) has been reached.
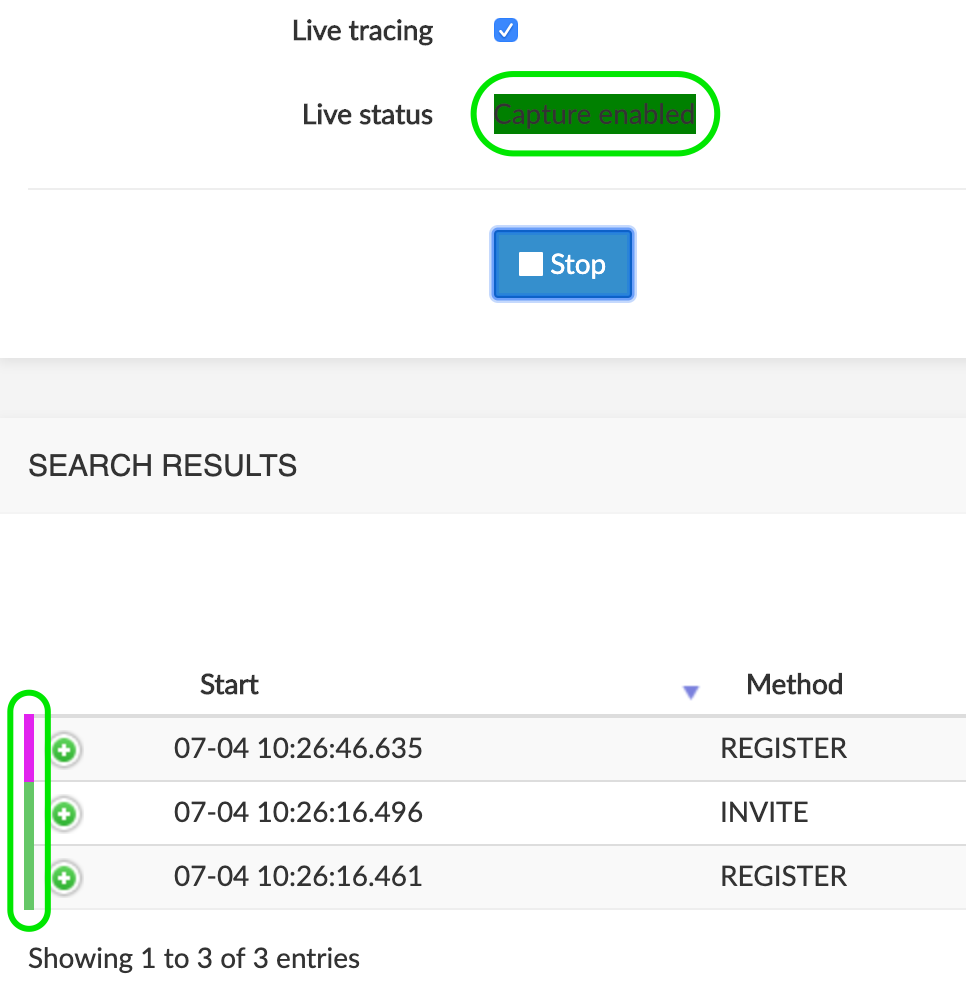
Green: "Capture enabled"
Click Search / Start to display the results in the Search Results browser window below.
The picture below shows the Live tracing mode active, the Live Status « Capture enabled », and in the Search Results browser below, one call with Live status (pink) and two with release cause 2XX or BYE (green) (see Release cause Color code).
Search Results Browser (Traces)
In the Search Results browser window, click to display the call flow for the call legs or correlated call, as illustrated below. See [Call Flow Tab] above for the description of the call flow diagram.


INFO
In some cases, NEMO cannot correlate legs into one row. When this situation happens, the two legs are listed with the same Call-Id, as illustrated below (orange rectangle).

Download Trace
In the Search Results window, click the icon of a call to download the call flow trace for further inspection using the Trace Analysis tool.
You can open the file using an external application or save the file, then submit it back to NEMO for further analysis. See [Trace Analysis] below for more details.
Search Recordings
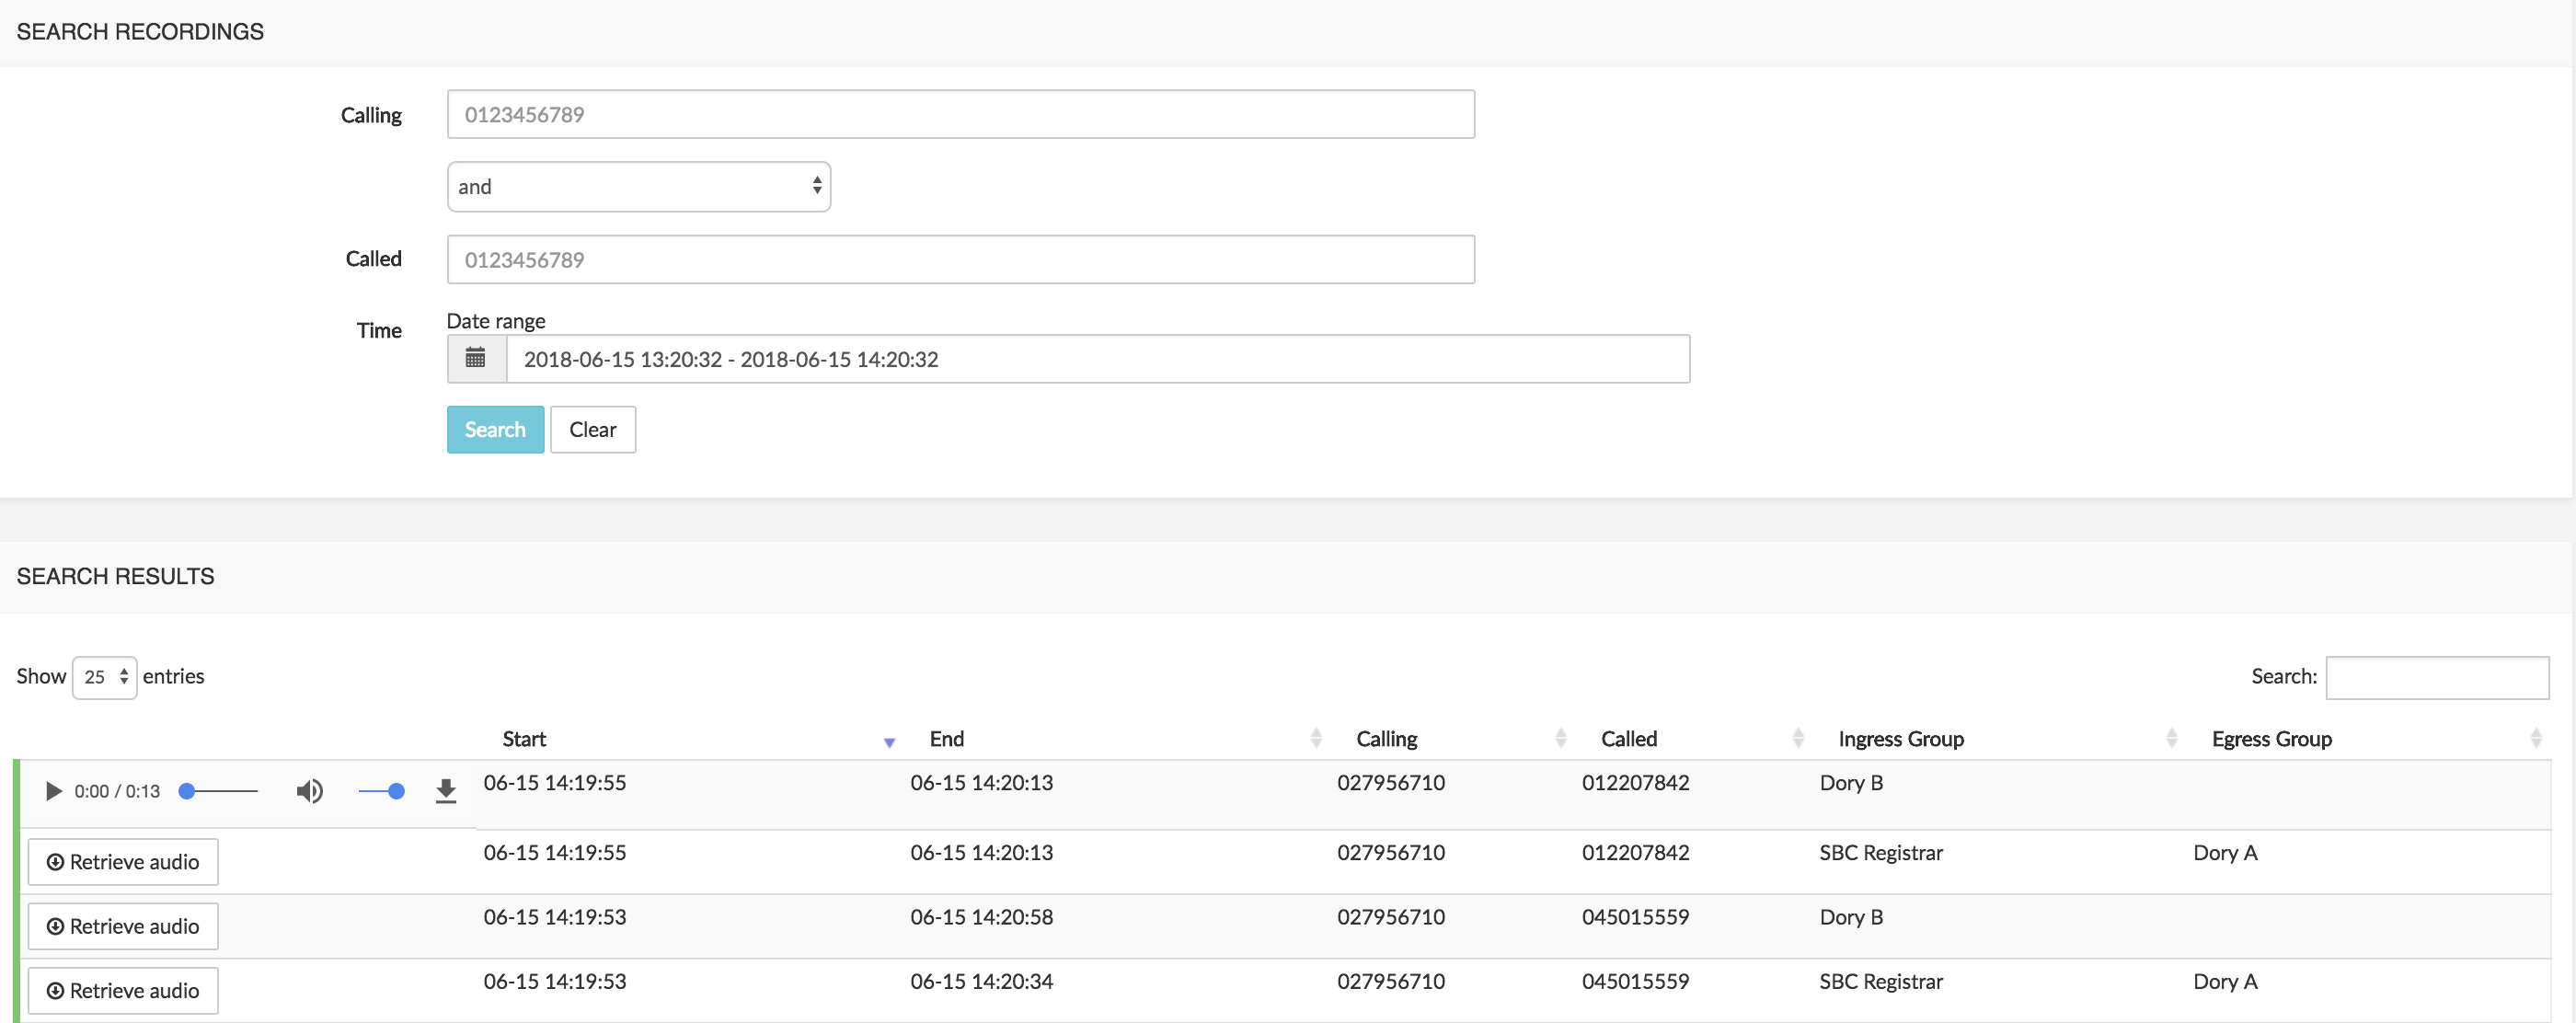
The Search Recordings command allows selecting calls to playback a record of the call or download an audio file. Calling part and called part are played back in the same player. Call details (call flow, etc.) are not available in this display.
The picture below shows a partial list of records, with the first one opened and its player ready to playback. For the controls of the player, see [Call flow details] above.
Trace Analysis
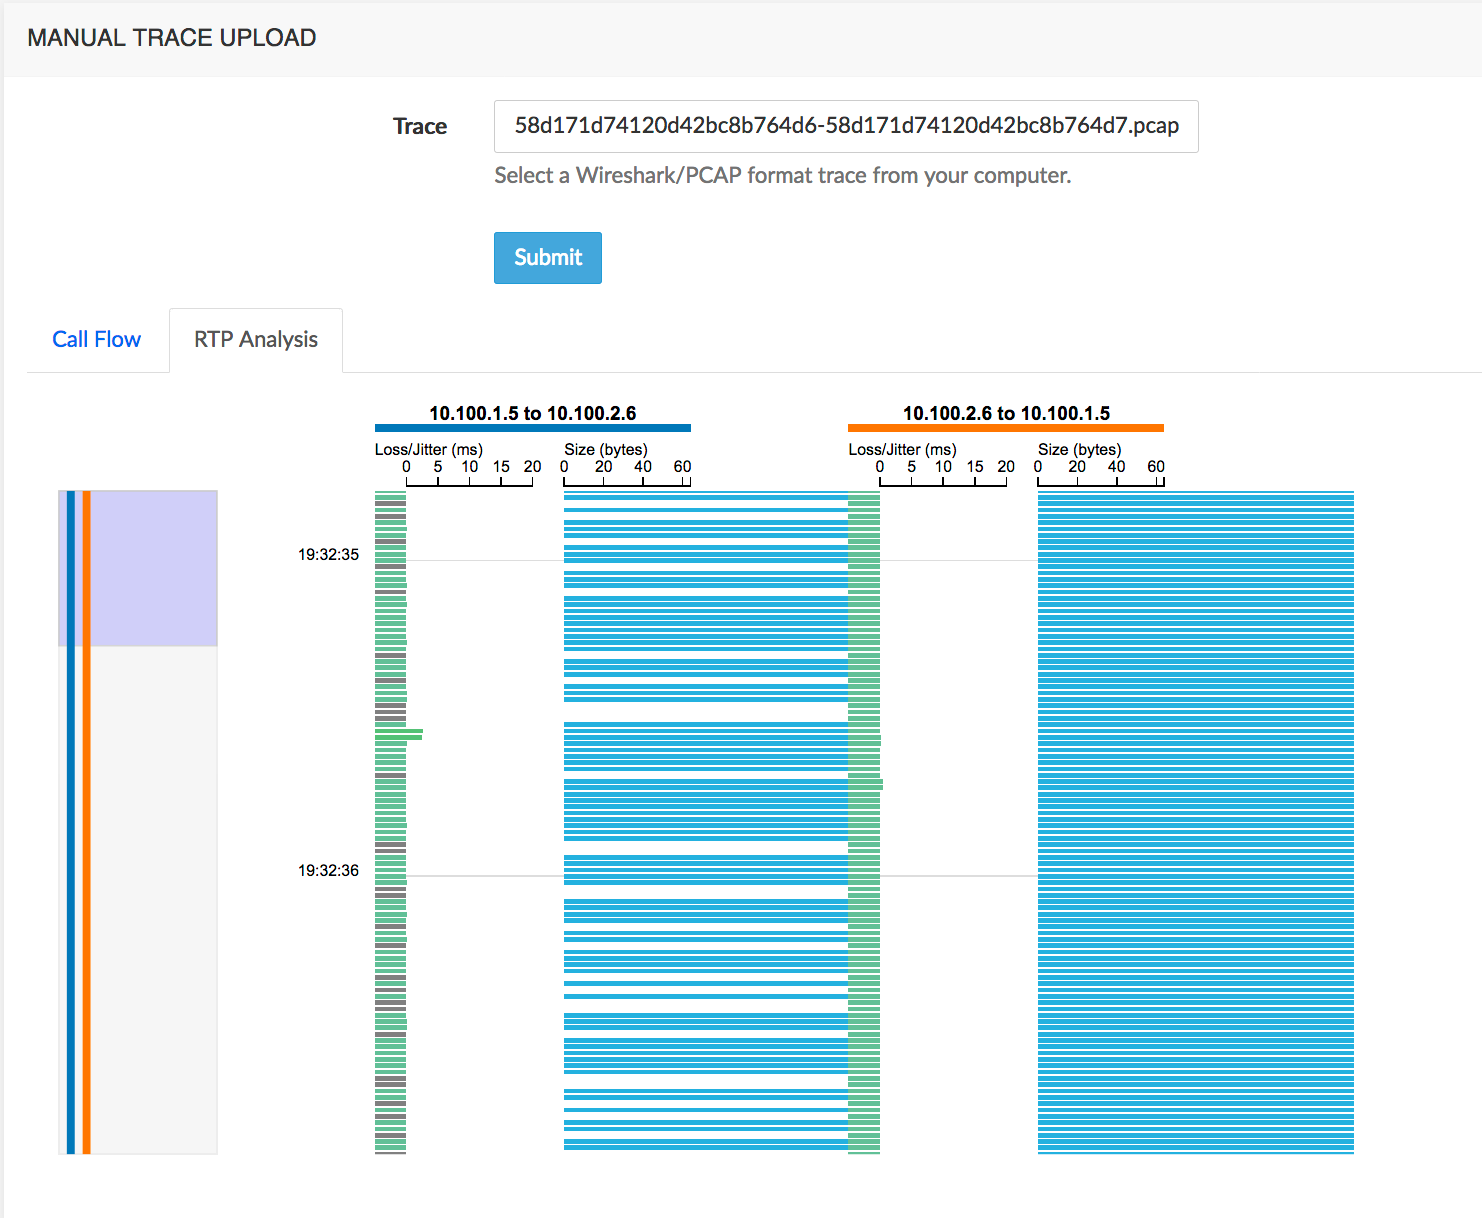
The Trace analysis command allows selecting a saved call flow trace file (.pcap file) and submitting it to NEMO. Once uploaded, the Manual Trace Upload window displays:
the Call Flow tab: this one is identical with the Call Flow tab shown in the Search Results window of the Search Calls sub-menu for the same call.
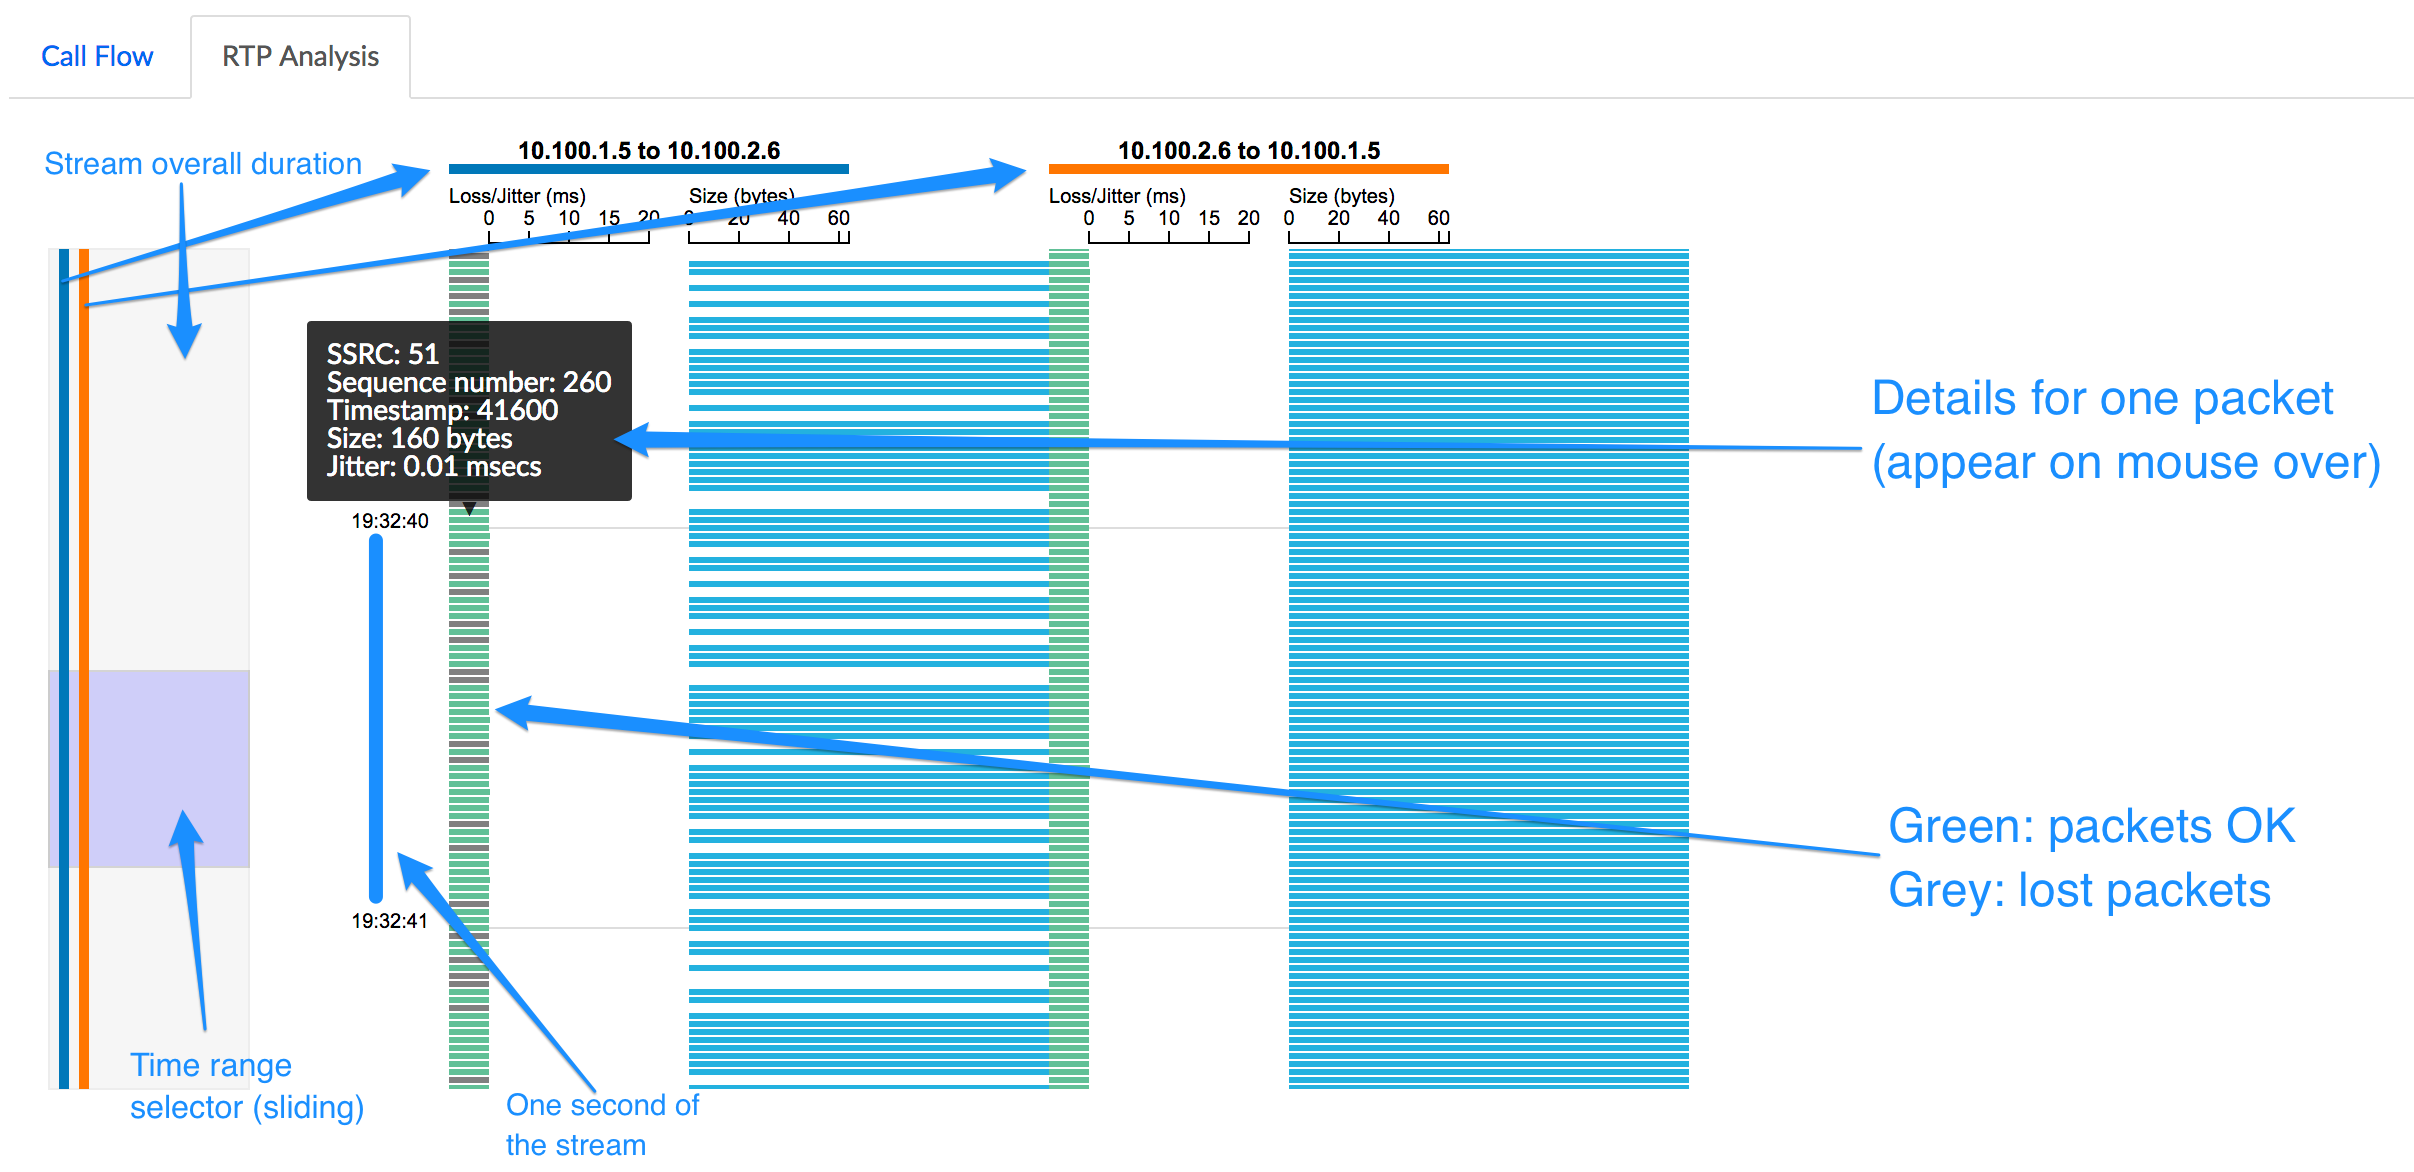
the RTP analysis tab: it displays the graphical representation of the RTP stream.
The figure below describes the components in the graphical representation.
Anomalies Module
Anomalies Browser
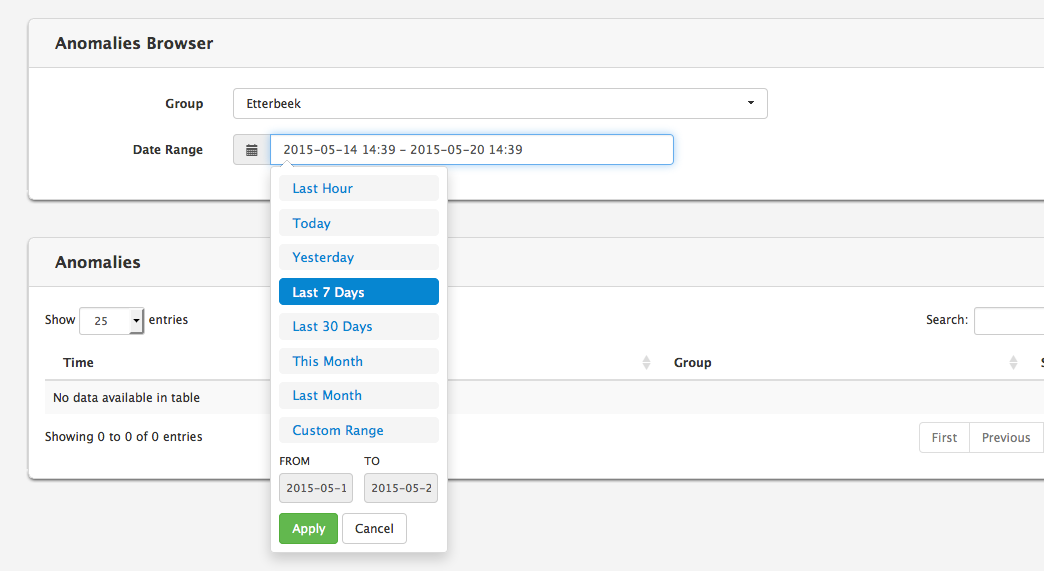
The Anomalies Browser, part of the Anomalies module, lists all the anomalies detected by the platform. The selection interface illustrated below allows searching the anomalies database for a specific group and period of time.
The results list, illustrated below, displays the anomalies matching the criteria defined in the selection interface, and shows the following columns:
- The start date/time of the time window during which the anomaly has been detected
- The anomaly type
- The group associated to this anomaly
- The severity
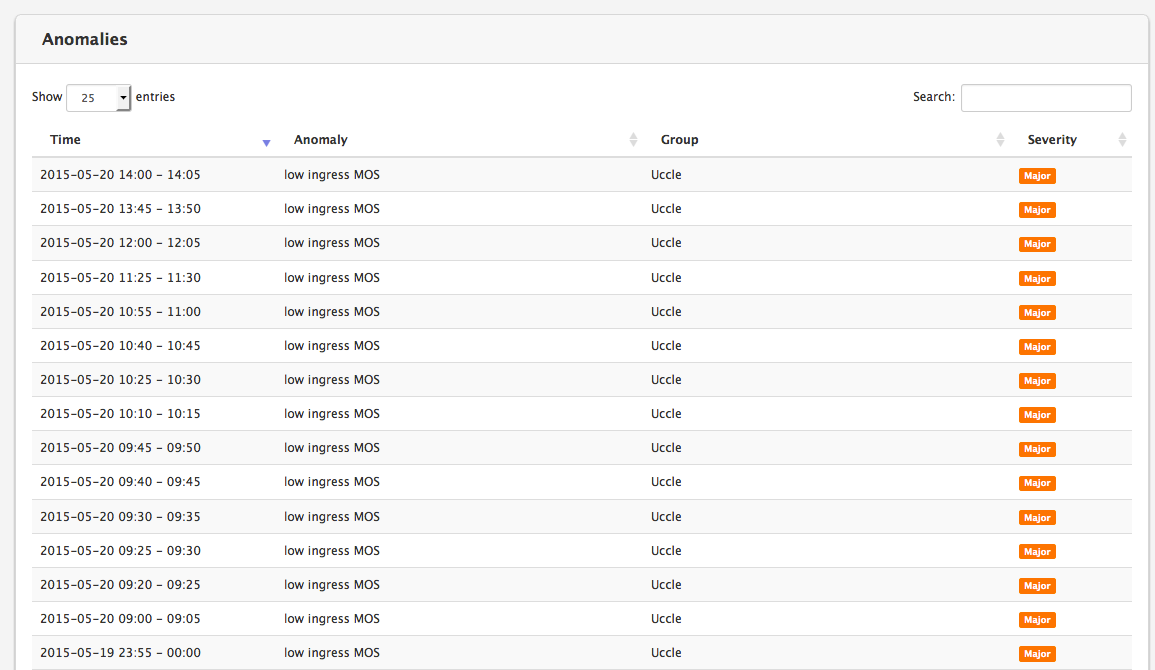
On the top right of the browser, the Search box provides a real-time filtering tool for the table.
The anomalies reported are filtered according to the realm privileges that the user has. In addition to that, a user can be configured to either see all anomalies profiles or only the anomalies profile he owns. See [Users] to know how to adapt these privileges.
The thresholds may differ for each realm, depending on the Anomalies Profile associated to the realms. See [Anomalies] for more information on Anomalies Profiles.
An Anomalies profile can contain several anomalies, and an anomaly can be defined using a set of up to five conditions. The anomalies are defined in Settings>Anomalies (Anomalies) : see [Anomalies Profile Properties] for more information.
SNMP Alarms
The SNMP Alarms browser window, illustrated below, selectively displays the alarms raised by the SNMP system(s) of the monitored equipment(s), on the condition that SNMP rules have been defined in [SNMP].
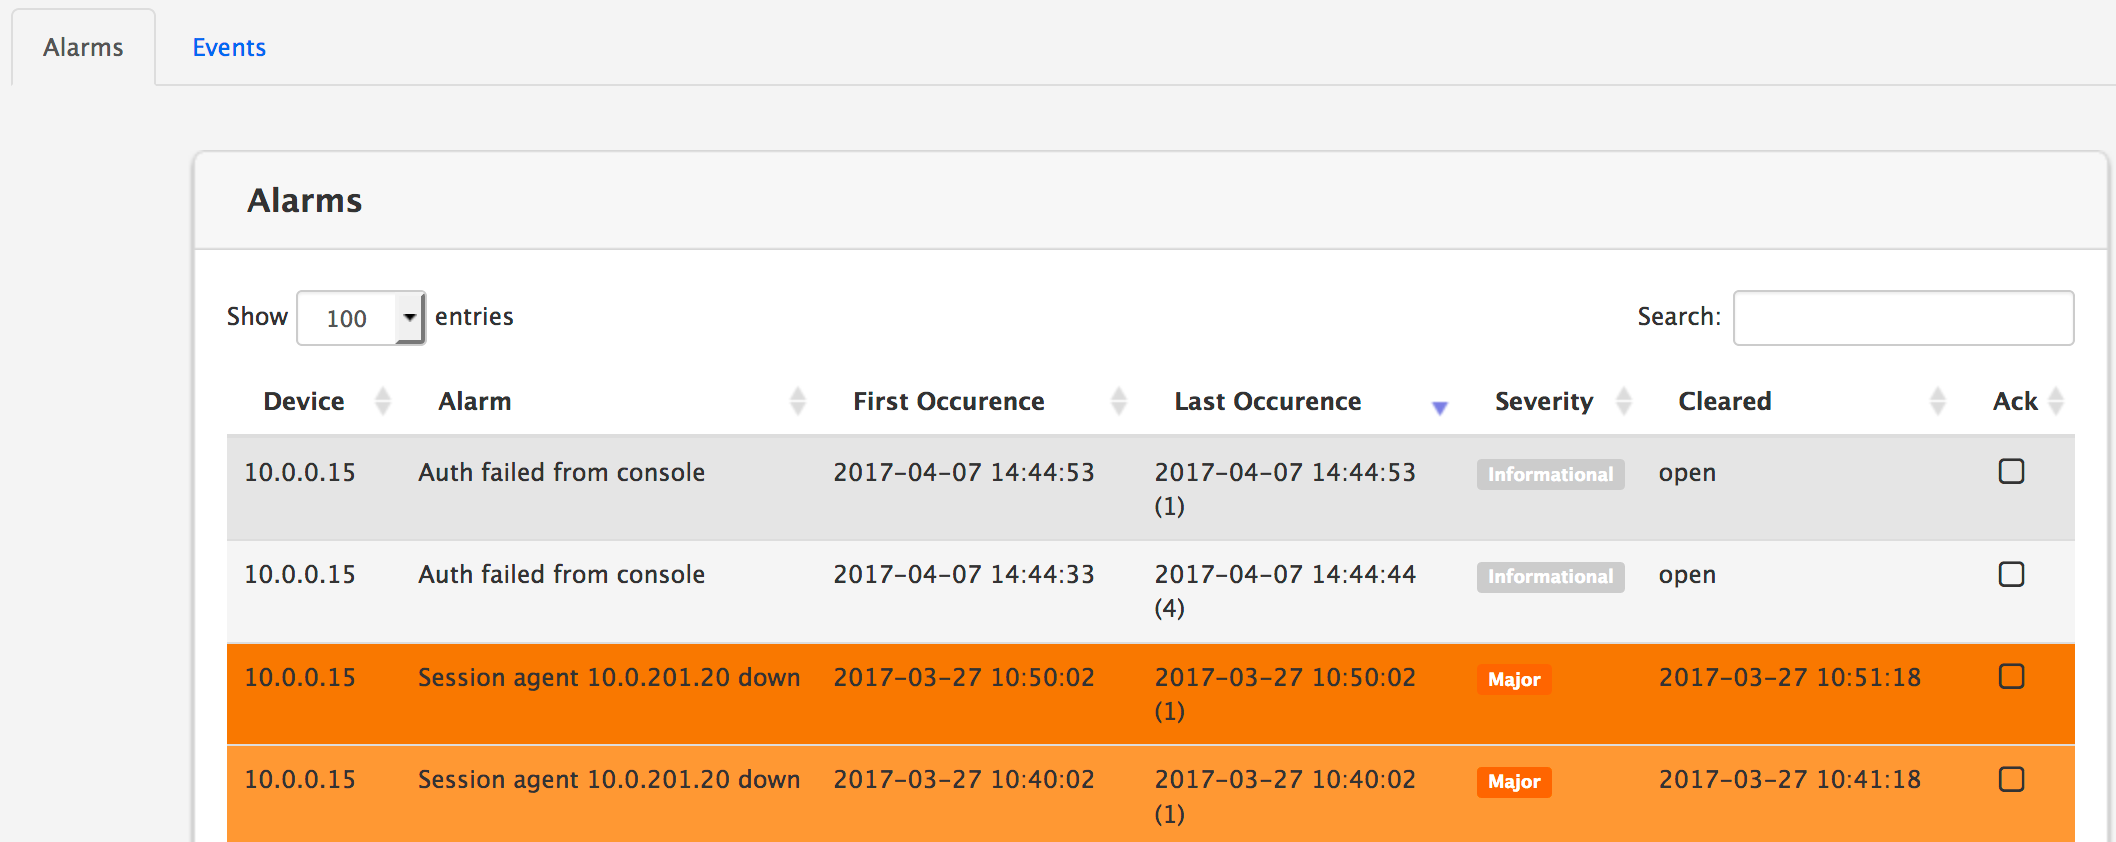
The window shows the following columns:
- Device is the IP address or reference of the emitting element
- Alarm is the name of the alarm as defined in [Create an SNMP Rule]
- First and Last Occurrence display the date, time and [number of occurrences] of the alarm
- Severity indicates the severity level defined in the alarm rule
- Cleared indicates when the alarm has been cleared
- Ack[knowledged] can be checked to indicate that a user has noticed the alarm (and, possibly, has taken action to clear it).
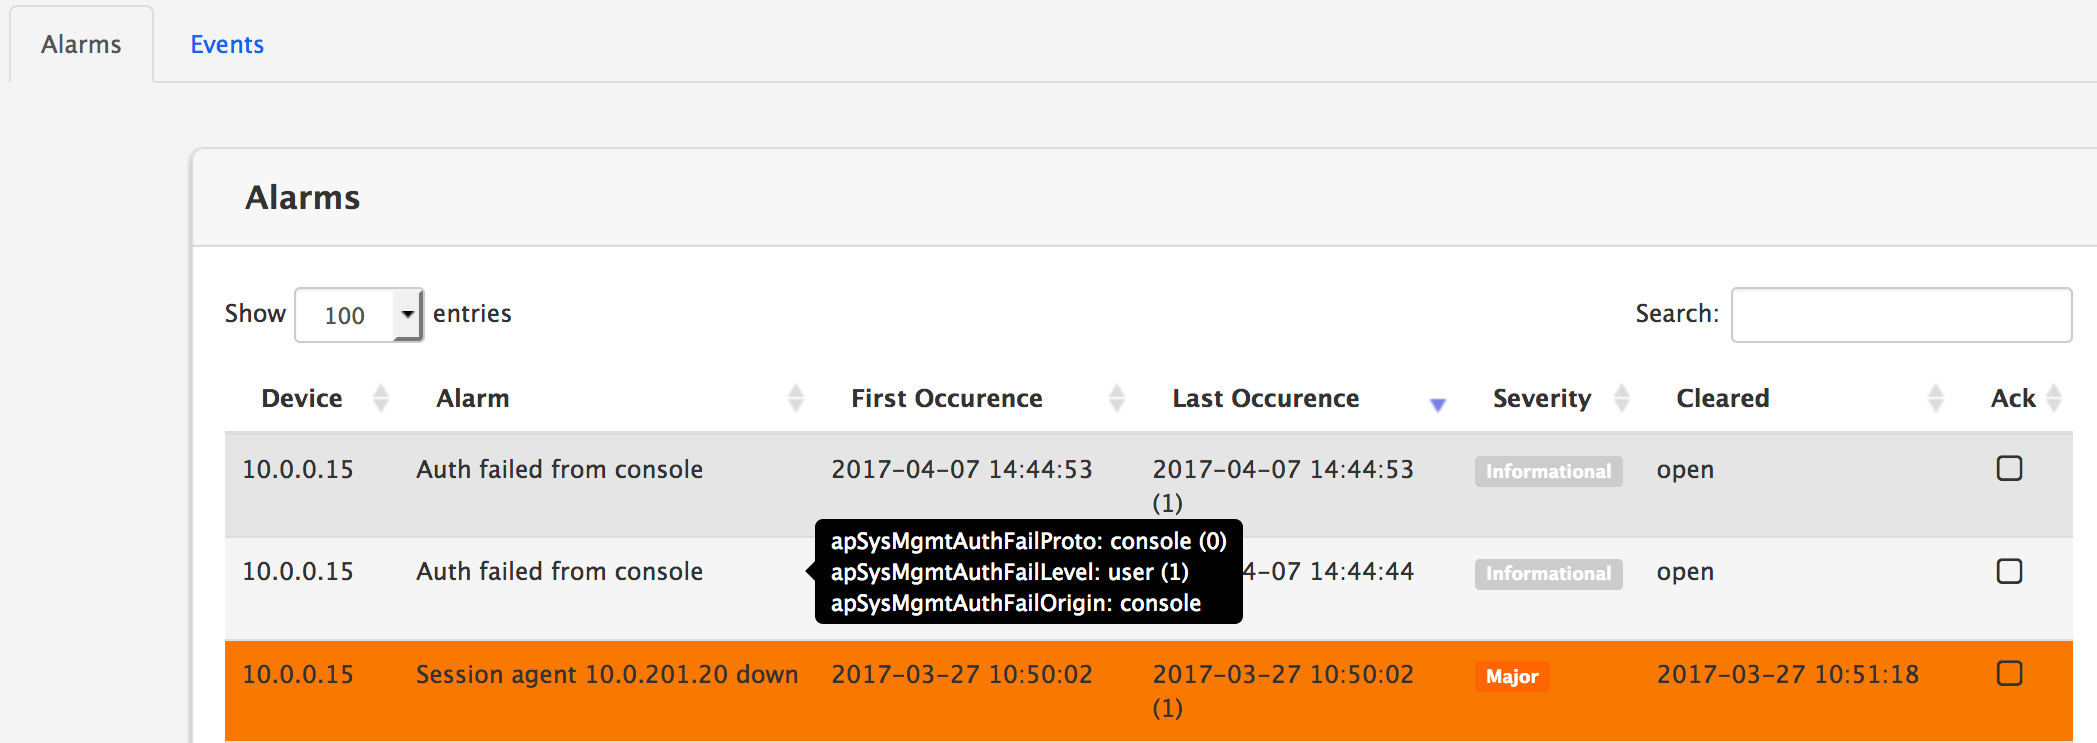
When hovering the mouse over the alarm name in the Alarm column, the variables of the alarm are shown onscreen in a white-on-black tooltip, as illustrated below.
Reporting Module
Reports
The Reporting module presents a browser window showing the reports available for three possible audiences, and accessible through the sub-menus by the name of the audience:
- Service Provider: typically the company delivering the VoIP service to the Customer
- Third Party, if present: acts as an interface between the Customer and the Service Provider
- Customer: the user of the VoIP service.
INFO
Mixed reports or reports aggregating different audiences are not available. The title of the Reports browser shows the target audience for the listed reports.
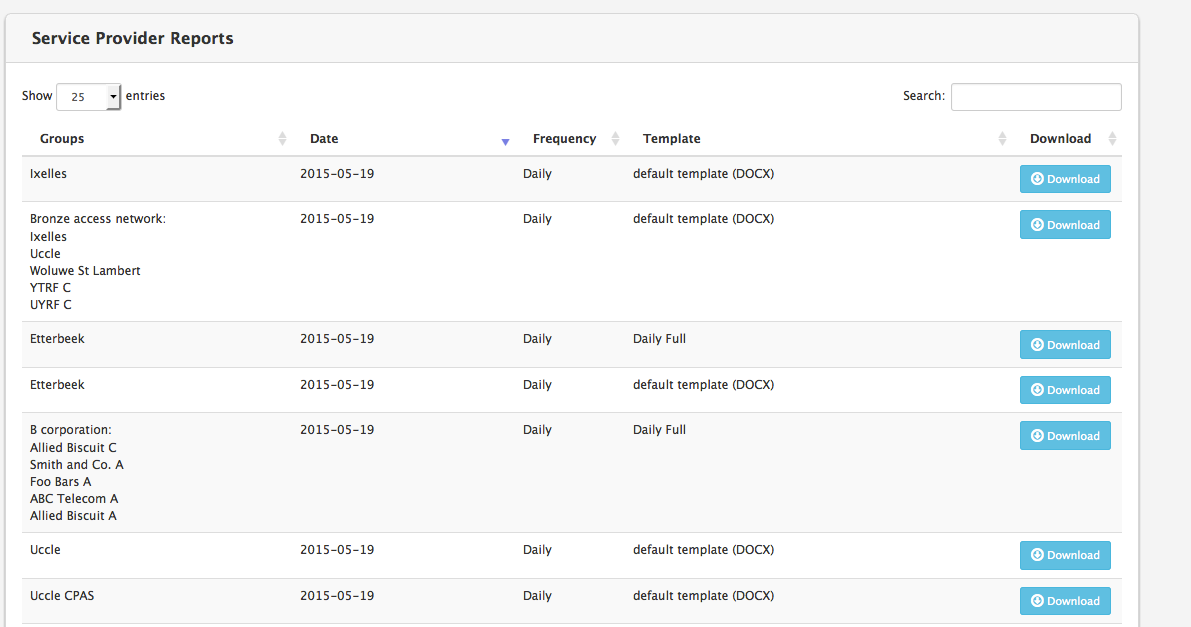
The [Audience] Reports browser, illustrated below, shows the following columns:
- Groups: the group name (realm name, group of realms (label), endpoint, trunk)
- Date: the start date of the report
- Frequency: the frequency of the report: daily, weekly or monthly
- Template: the name of the reporting template used to build this report
- Download: action button to download the report file.
Statistics Exports
The Statistics exports sub-menu presents a browser window allowing users to search and filter statistics and download them in .csv format. The CSV files are created according to a Statistics Profile. For more information about Statistics Profile, see [Statistics exports] .
The Statistics Exports browser, illustrated below, shows the following columns:
- Export Profile: the profile defining the frequency and content of the
.csvfile. - Date: only statistics for that specific date are present in the
.csvfile. - Frequency
- Download: button allowing to download the stats
.csvfile.

CDR Exports
The CDR Exports sub-menu presents a browser window allowing users to search and filter CDRs and download them in .csv format. The CSV files are created on a daily basis.
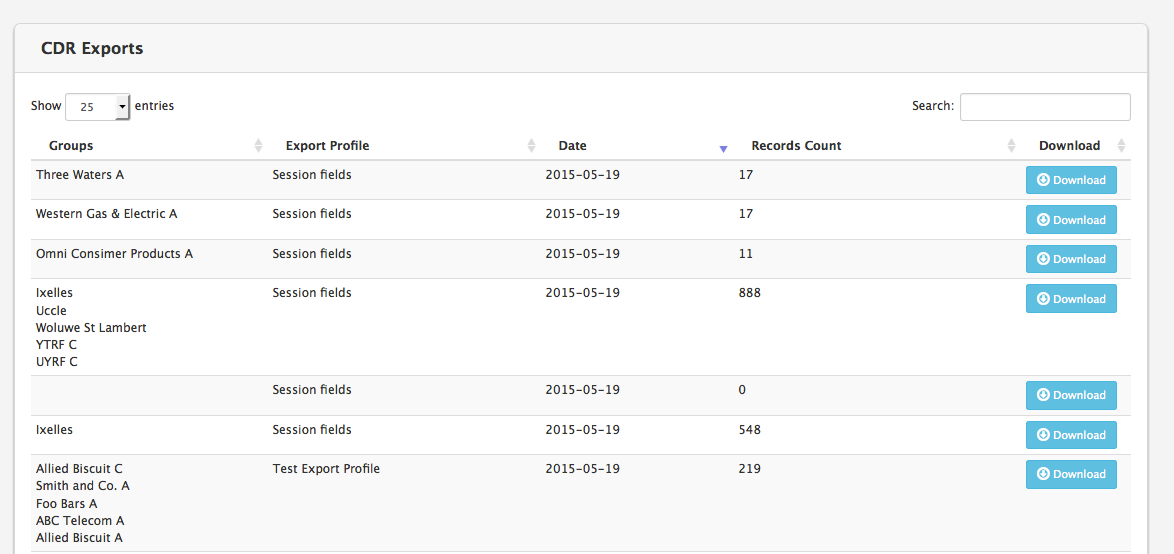
The CDR Exports browser, illustrated below, shows the following columns:
- Groups: the realms, group of realms (label), endpoints or trunks the
.csvfile is related to. - Export Profile: the profile defining which CDR fields will be present in the
.csvfile. - Date: only CDRs for that specific date are present in the
.csvfile. - Records count: the number of CDRs in the
.csvfile. - Download: action button to download the CDRs
.csvfile.
Settings Module
The Settings module provides an access to every configurable or editable setting of NEMO. Given the potential impact of configuration changes over the behaviour of NEMO, access rights to this module should be granted to NEMO Administrators and experienced users only.
WARNING
Some technical, low-level settings in the System sub-menu are not described in this User Guide. They are managed at installation and deployment time by Netaxis Installation and Support team, and should not be modified by NEMO administrators or users.
Users
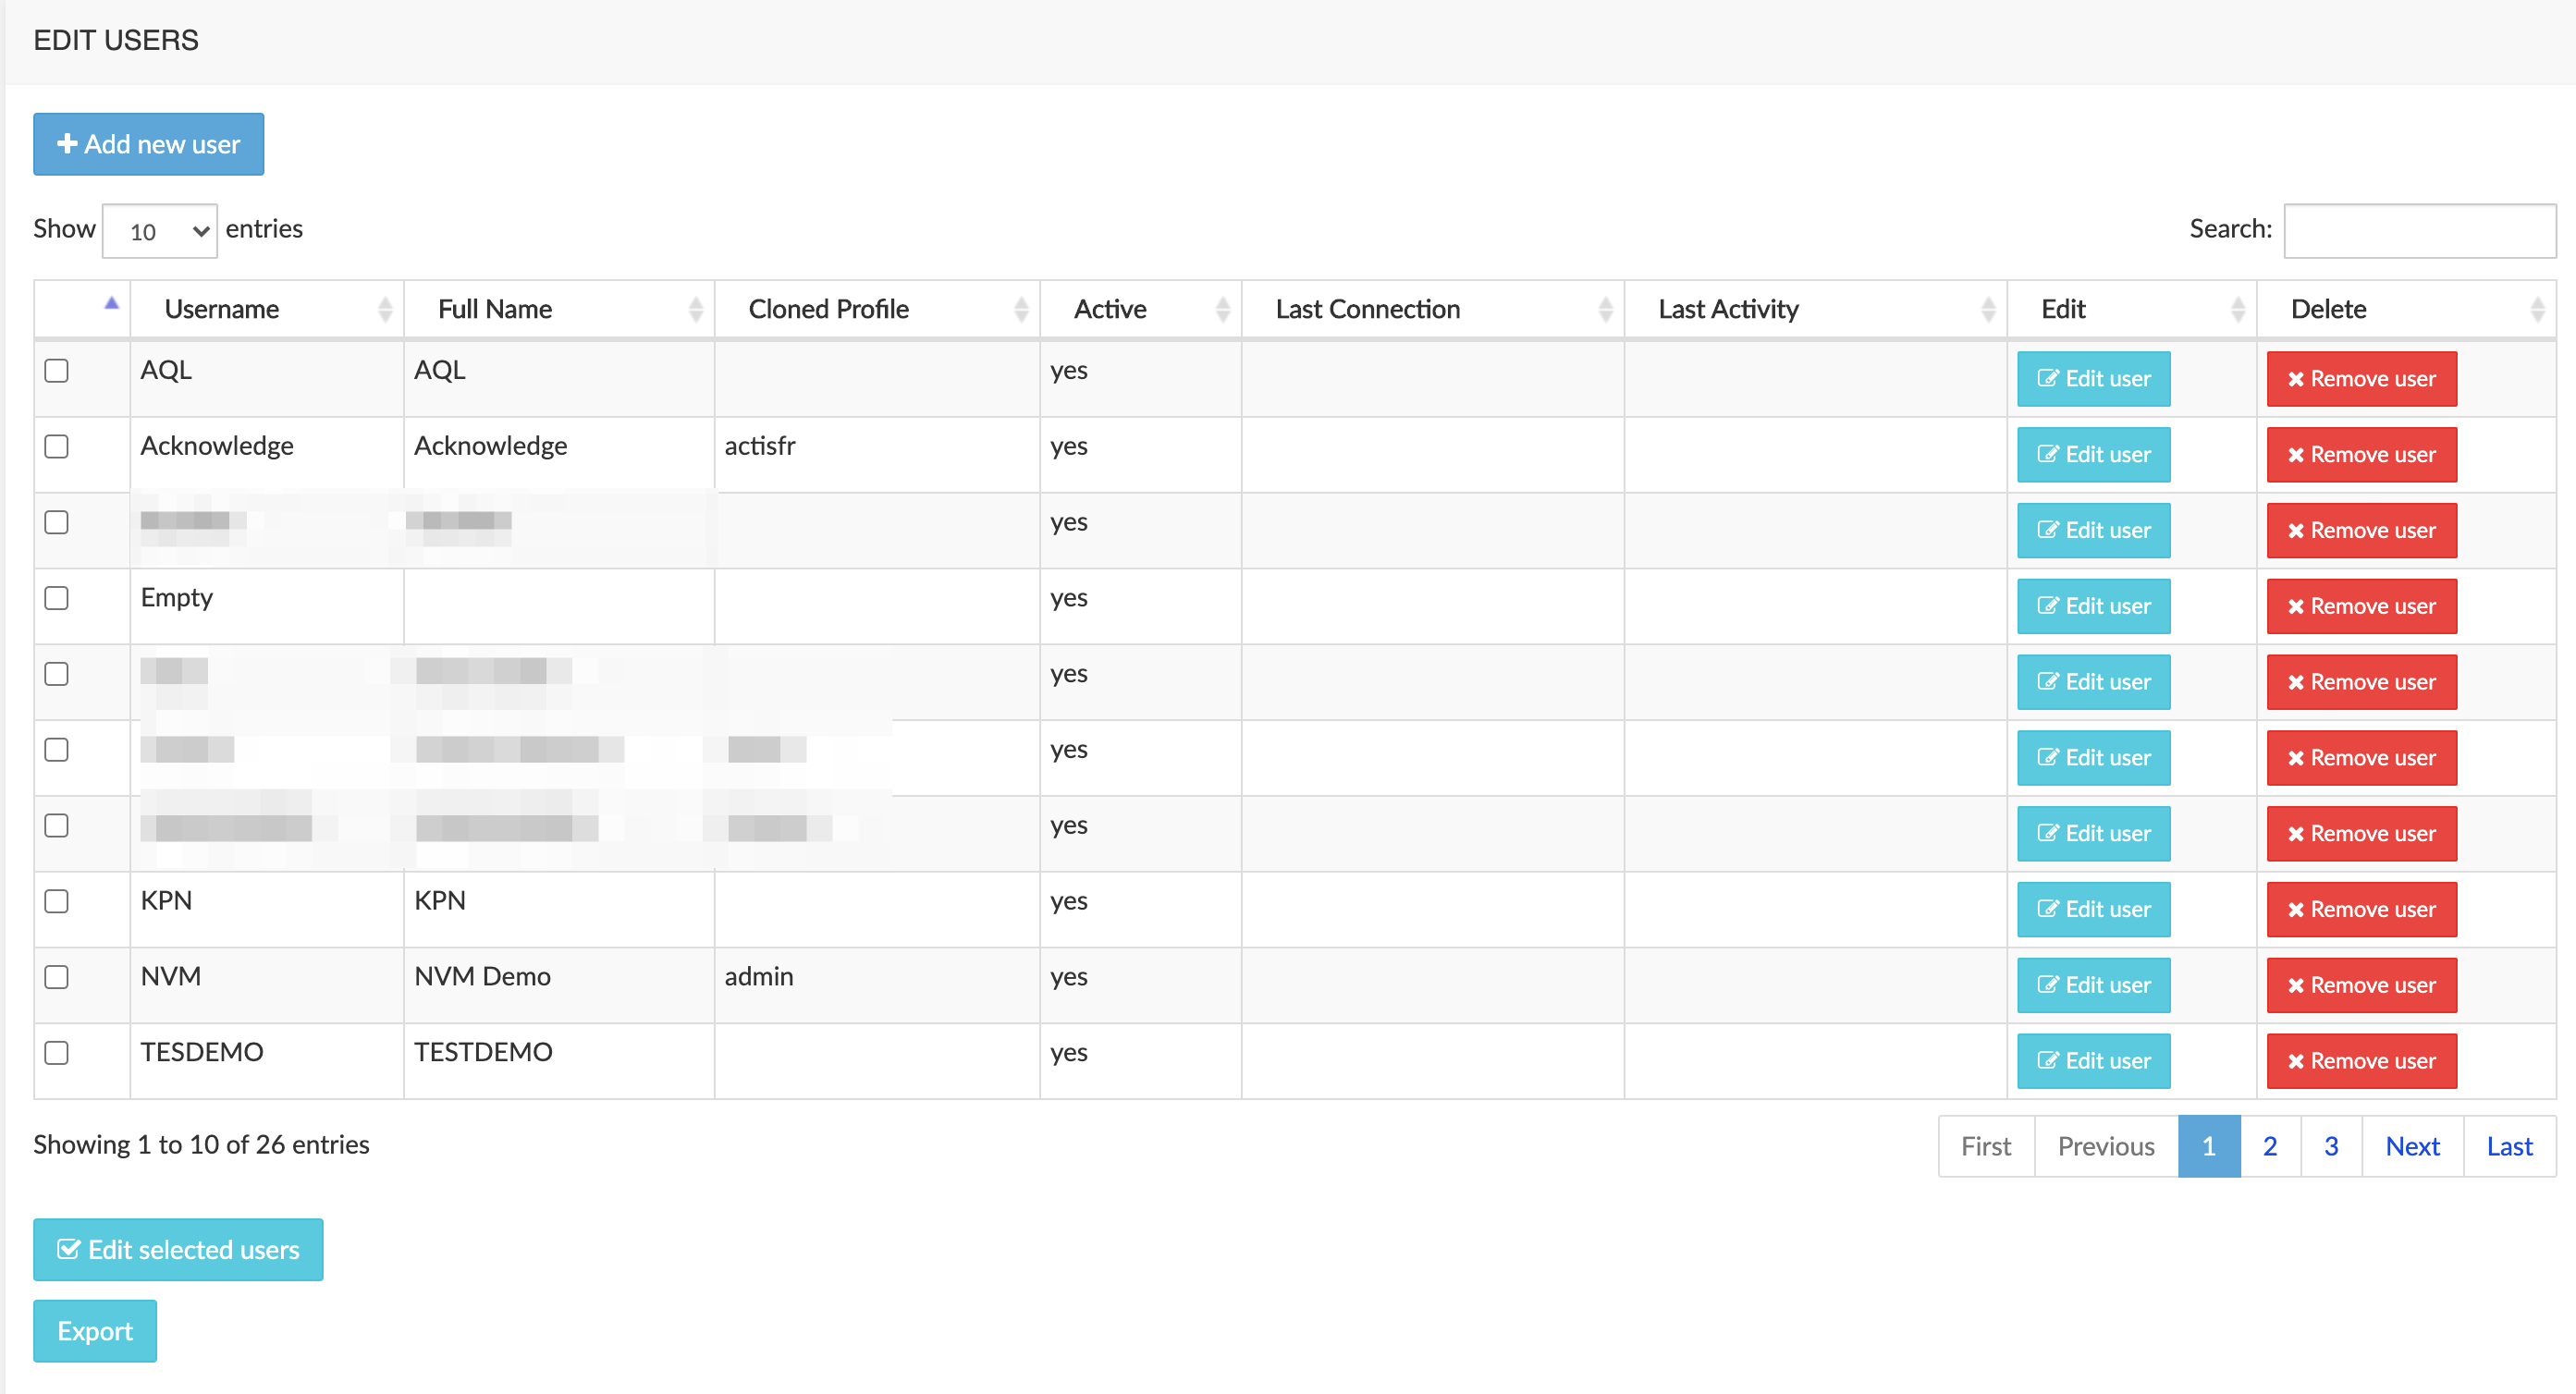
The main Edit Users interface, illustrated below, lists all the users currently provisioned on the system.
The Export button (bottom left) allows saving locally a CSV file having all the entries in the list (not only the ones displayed: in this case, 26 entries, not only the 10 shown).
Create a User
To create a user, click the Add new user button to open the User Account tab, illustrated below. Use this tab to provide user details such as user name, full name and password.

The Profile tab, illustrated below, allows defining the profile for this user in two different ways:
- Default user profile: default user options, prevent access to everything
- Clone the profile of another user already provisioned in the system.

Click the Save button to save the new user.
Edit an Existing User
To modify the access rights for an existing (or just created) user, click the Edit user link in the Edit column of the main Edit Users window (see [Edit Users list] above).
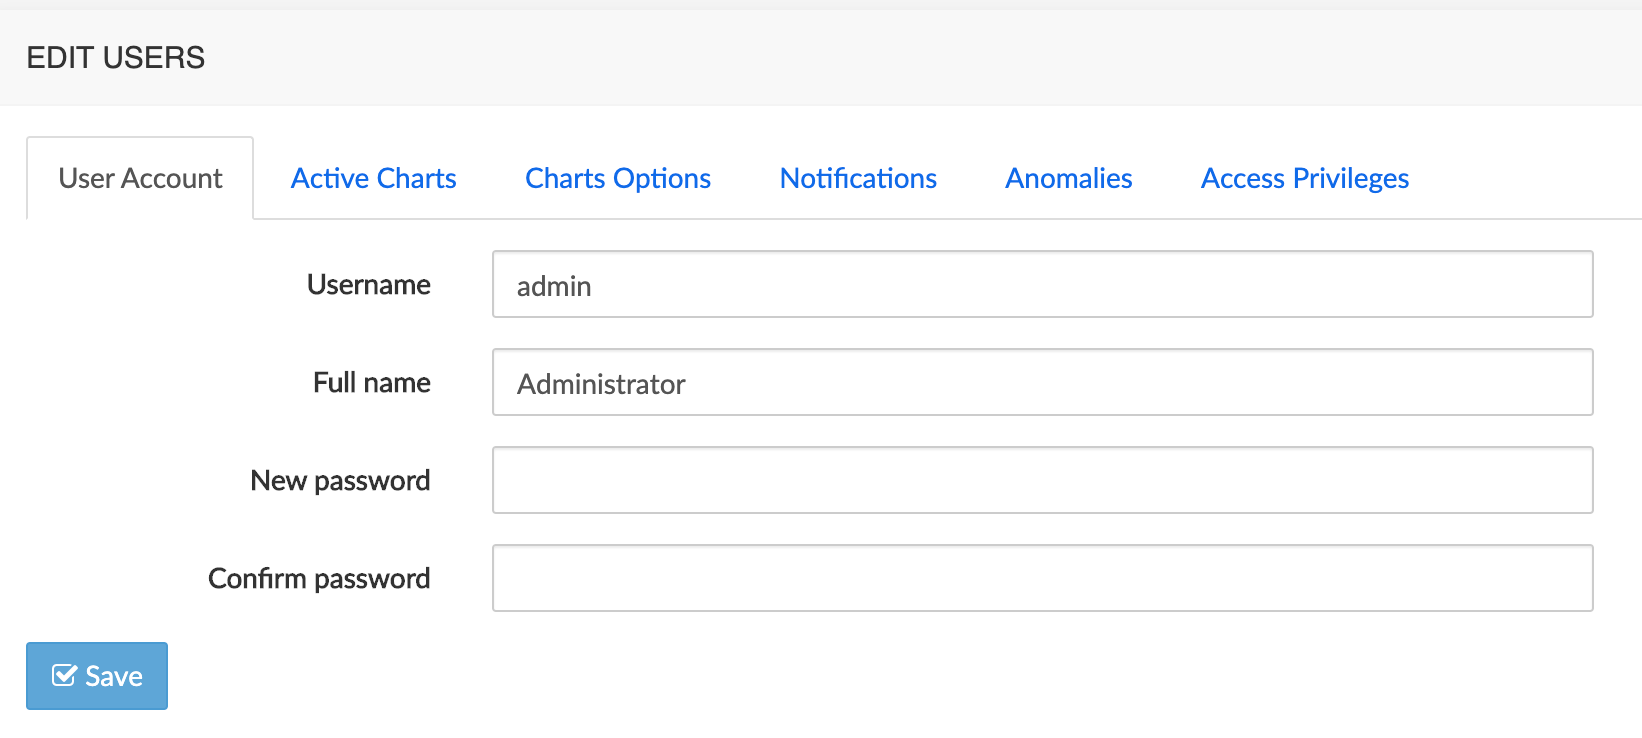
The User Account tab allows editing the full name and providing a new password, as illustrated below.
The Active Charts tab, illustrated below, lets you select which charts are available to the user.

The Charts options tab, illustrated below, lets you set several options for the charts. It is possible to customize which types of groups should be displayed. Besides these plugin-specific options, common options are available:
- Aggregate data by default
- Allow user to change aggregation setting
- Expose trend option (post-processing)
- Display total capacity line when max total simultaneous calls reach (%)
- Rename ingress & egress terms
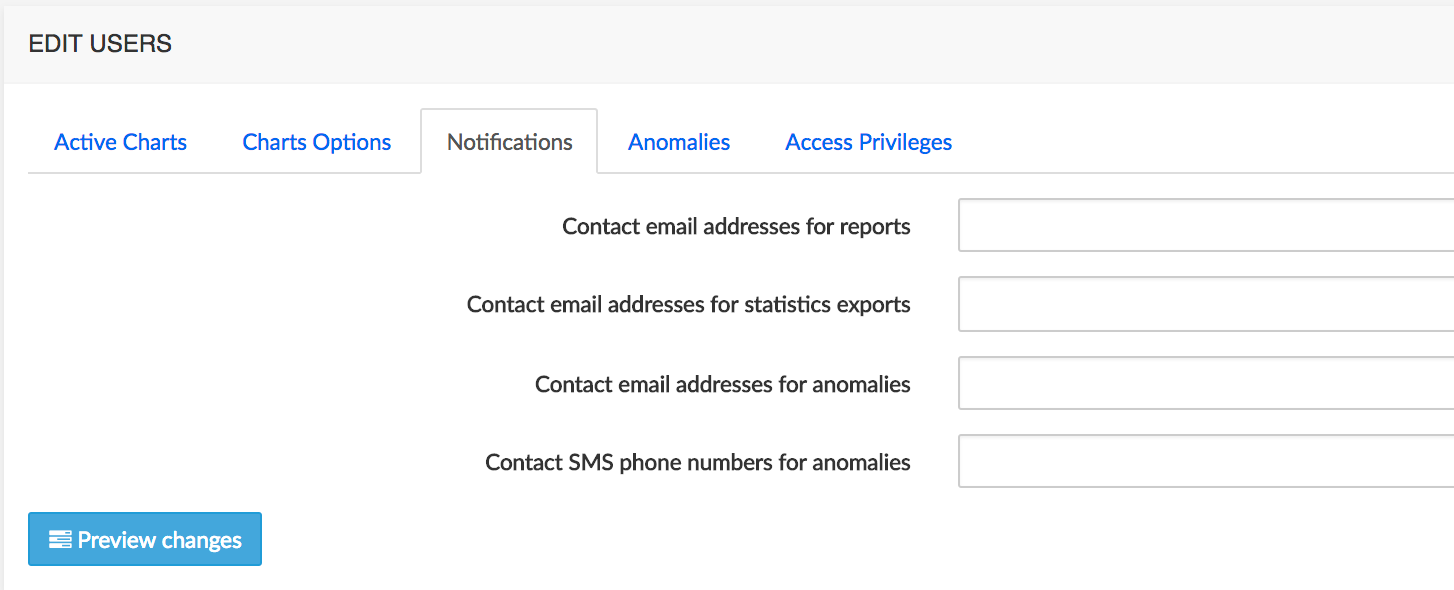
The Notifications tab, illustrated below, lets you set the parameters allowing NEMO to send notifications to the user.
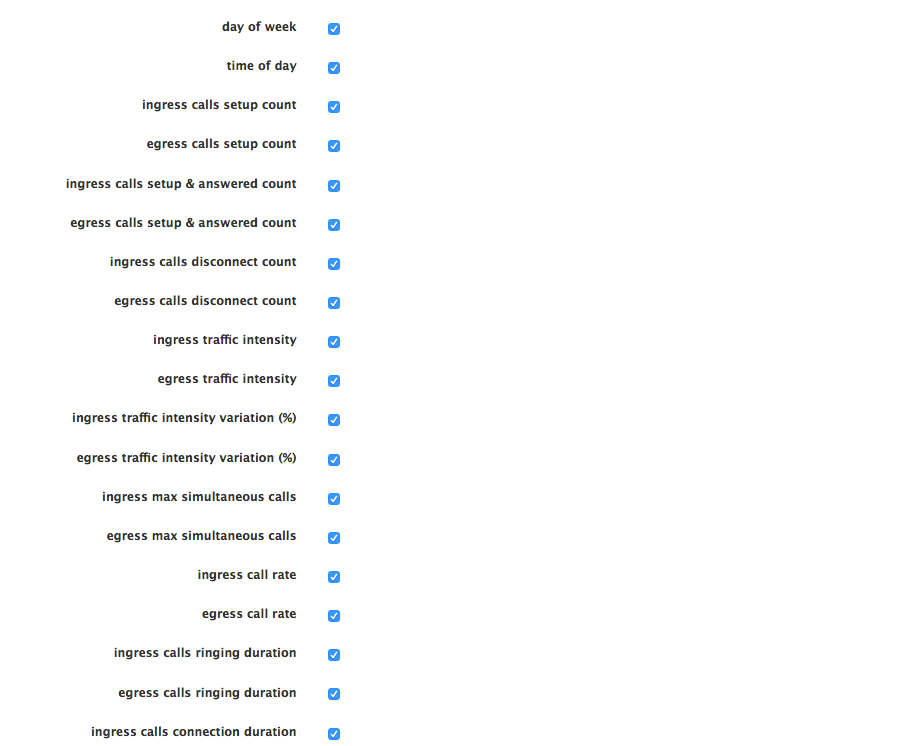
The Anomalies tab, illustrated below, lets you set which conditions the user has access to in order to define anomalies, as explained in [Anomalies].
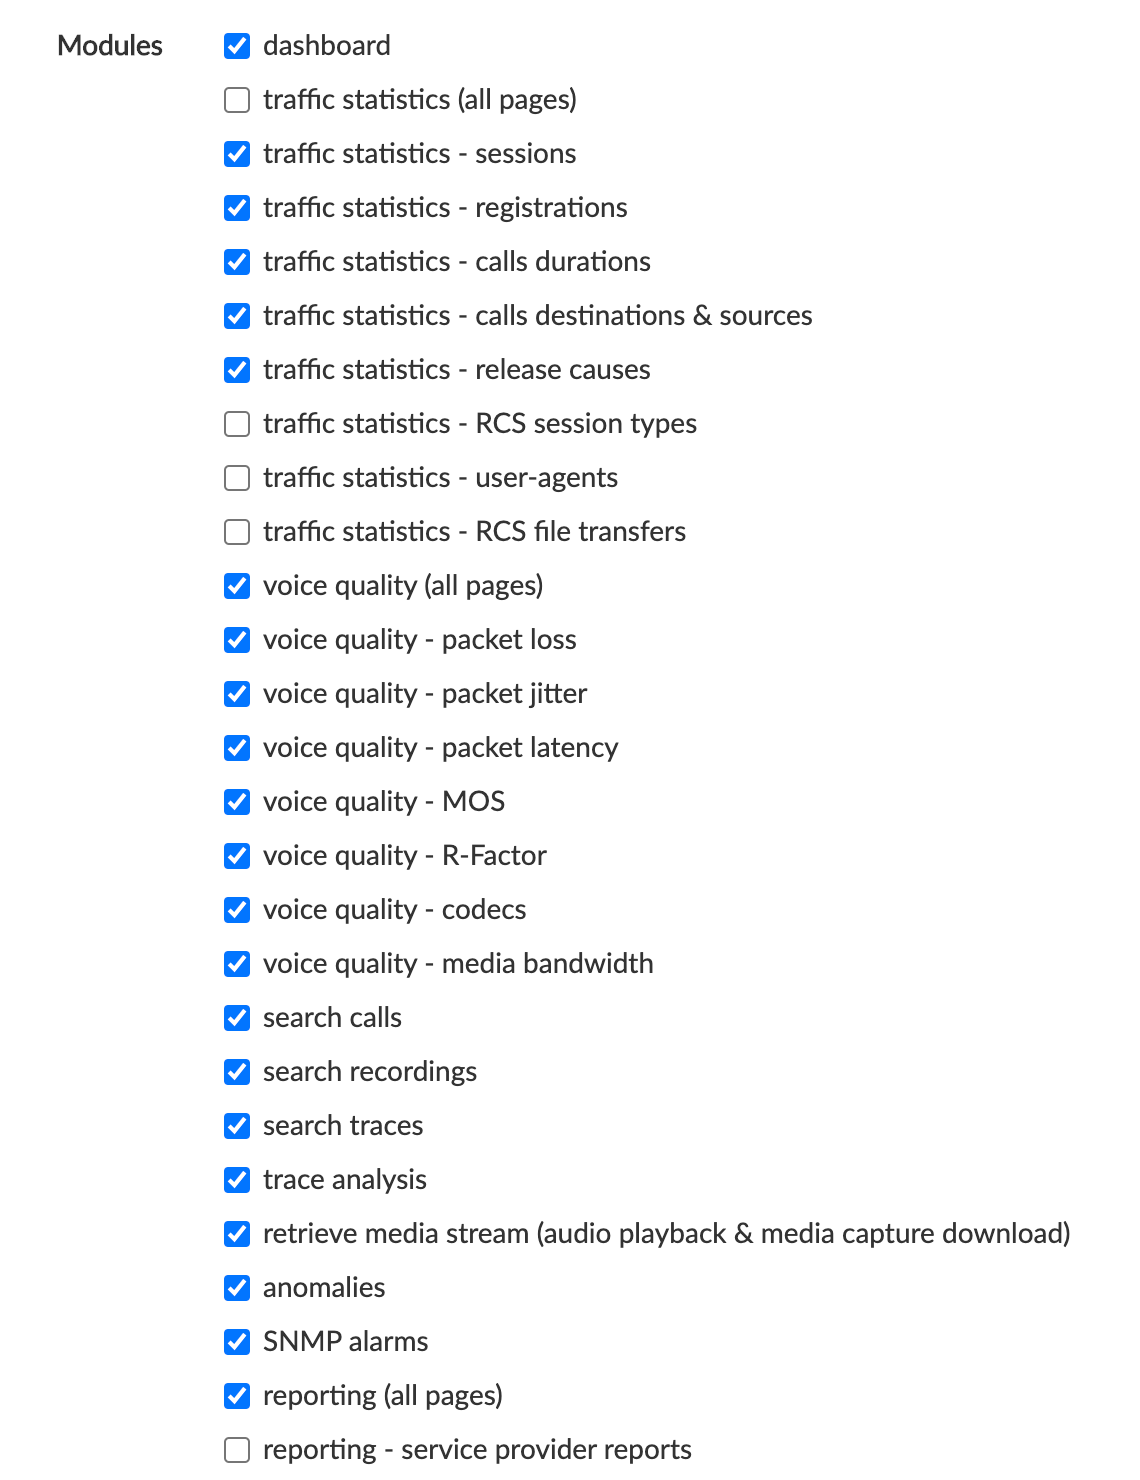
The Access Privileges tab, partially illustrated below, lets you configure the access rights for the modules, groups, reports and anomalies.
You can grant or prevent access to specific settings in the Modules section of this tab. Use it, for instance, to prevent access to the system configuration interface or to prevent access to individual calls, traces or media streams.
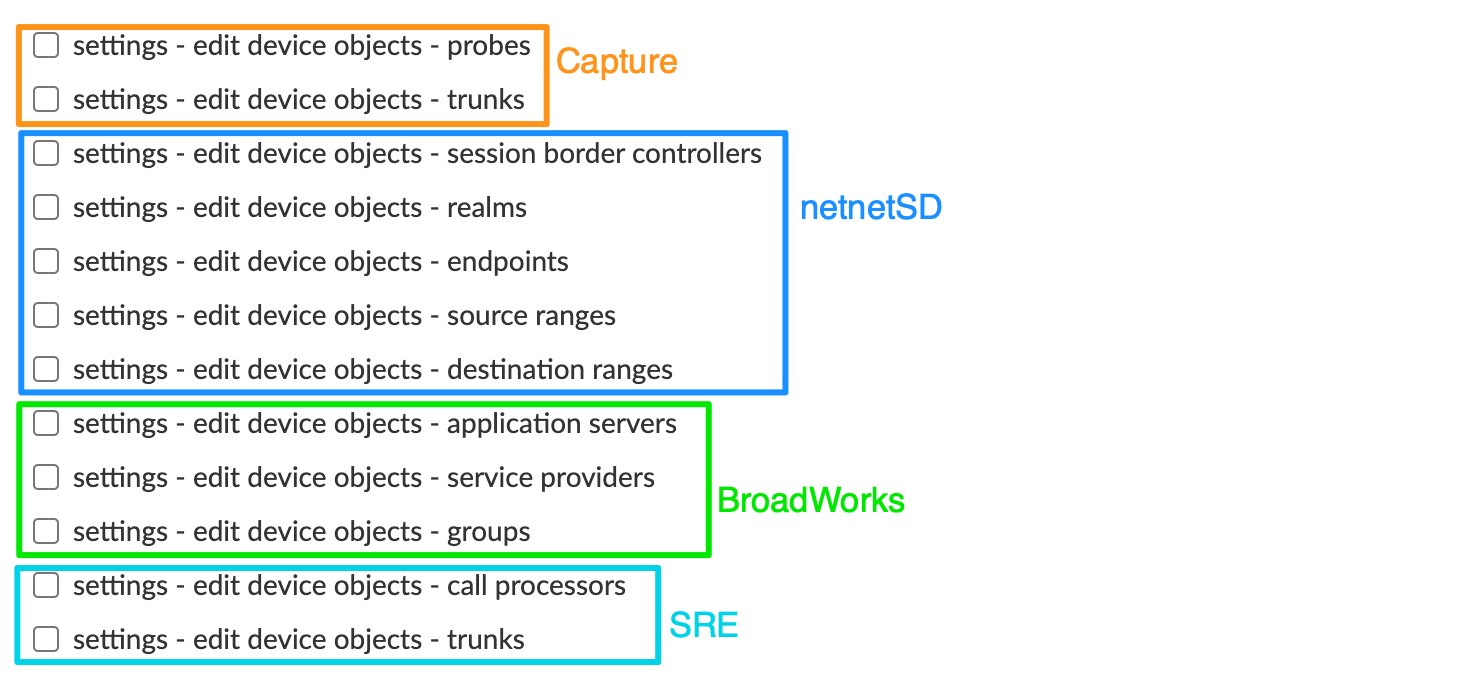
Individual access to the devices' logical entities (here called device objects) is part of this Modules list, discretely grouped by device as shown below:
The Groups section, illustrated below, lets you select which groups the user has access to. These settings affect what data can be retrieved in the Call Statistics, Voice Quality, Anomalies and Reports modules. Several choices are available:
- prevent access to all groups
- grant access to all groups
- grant access to these groups (select the groups in the drop-down list)

INFO
Granting access to a group (directly or through labels) automatically grants access to all the sub-groups children of this group.
The Reports section, illustrated below, lets you select which reports the user has access to. These settings affect which reports are displayed in the Reports Browser, as explained in [Reports].
Several choices are available:
- Prevent access to any report
- Grant access to all reports
- Grant access to specific report types
- Grant access to specific reporting templates.
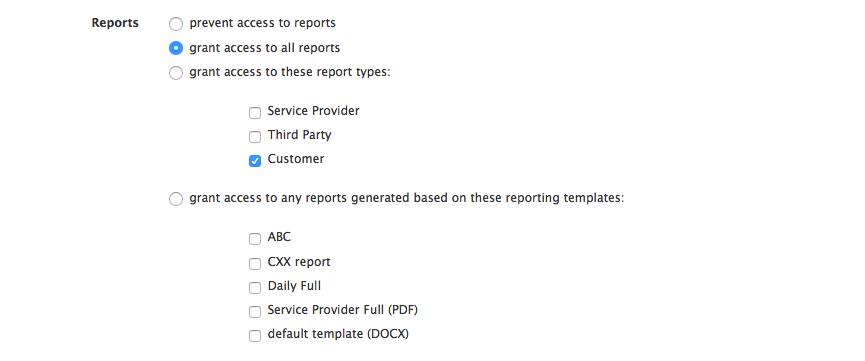
The Stats export section lets you select which stats the user is authorized to export.
Several choices are available:
- Prevent access to reports
- Grant access all reports
- Grant access to selected reports
- Grant access to reports generated by the selected report templates
The Anomalies section, illustrated below, lets you select which anomalies the user has access to. This setting affects which anomalies are displayed in the Anomalies Browser, as explained in [Anomalies Browser].
Several choices are available:
- Grant access to own anomalies profiles (user will only see anomalies linked to the anomalies profiles he has created)
- Grant access to all anomalies profiles (user will also be able to see the anomalies created by other users).

API
The API section prevents or grants the access to APIO layer API (for integration with APIO self-care portal).
Remove a User
To remove an existing user from the system, click the Remove User link in the Remove column of the main Edit Users window (see [Edit Users list] above).
Configuration Objects Provisioning
Depending on the plugin(s) currently active and the access privileges granted for the current user, several menus are available, to configure so-called device objects. These device objects are composed of root elements (e.g. Oracle SBC, Probe, Broadworks Application Server, ...), parent of base groups. These base groups are the root level of aggregation (from a statistical point of view) for a plugin. There may be sub-groups, children of these base groups.
Labels
Labels can be used to create logical groups of realms or endpoints or of trunks. Several labels can be assigned to the same realm or endpoint, or trunk. For instance, a label can be created to tag all realms or all trunks belonging to small and medium enterprises, and another label can be created to tag all realms or all trunks with a specific IP access network.
Labels can later be used to produce reports for grouped realms or grouped trunks.
Edit Labels
The Edit Labels list, illustrated below, lists all the labels currently provisioned on the system and lets you modify the label names or specify the total calls capacity for this range. This capacity is displayed in the Max Simultaneous Calls chart as an horizontal line. This table allows you also to delete the labels. This can be achieved by selecting the label and clicking the Delete Selected button.
WARNING
Deleting a label does NOT delete any of the items tagged with this label.
The Export button (bottom left) allows saving locally a CSV file having all the entries in the list (not only the ones displayed: in this case, 26 entries, not only the 10 shown).
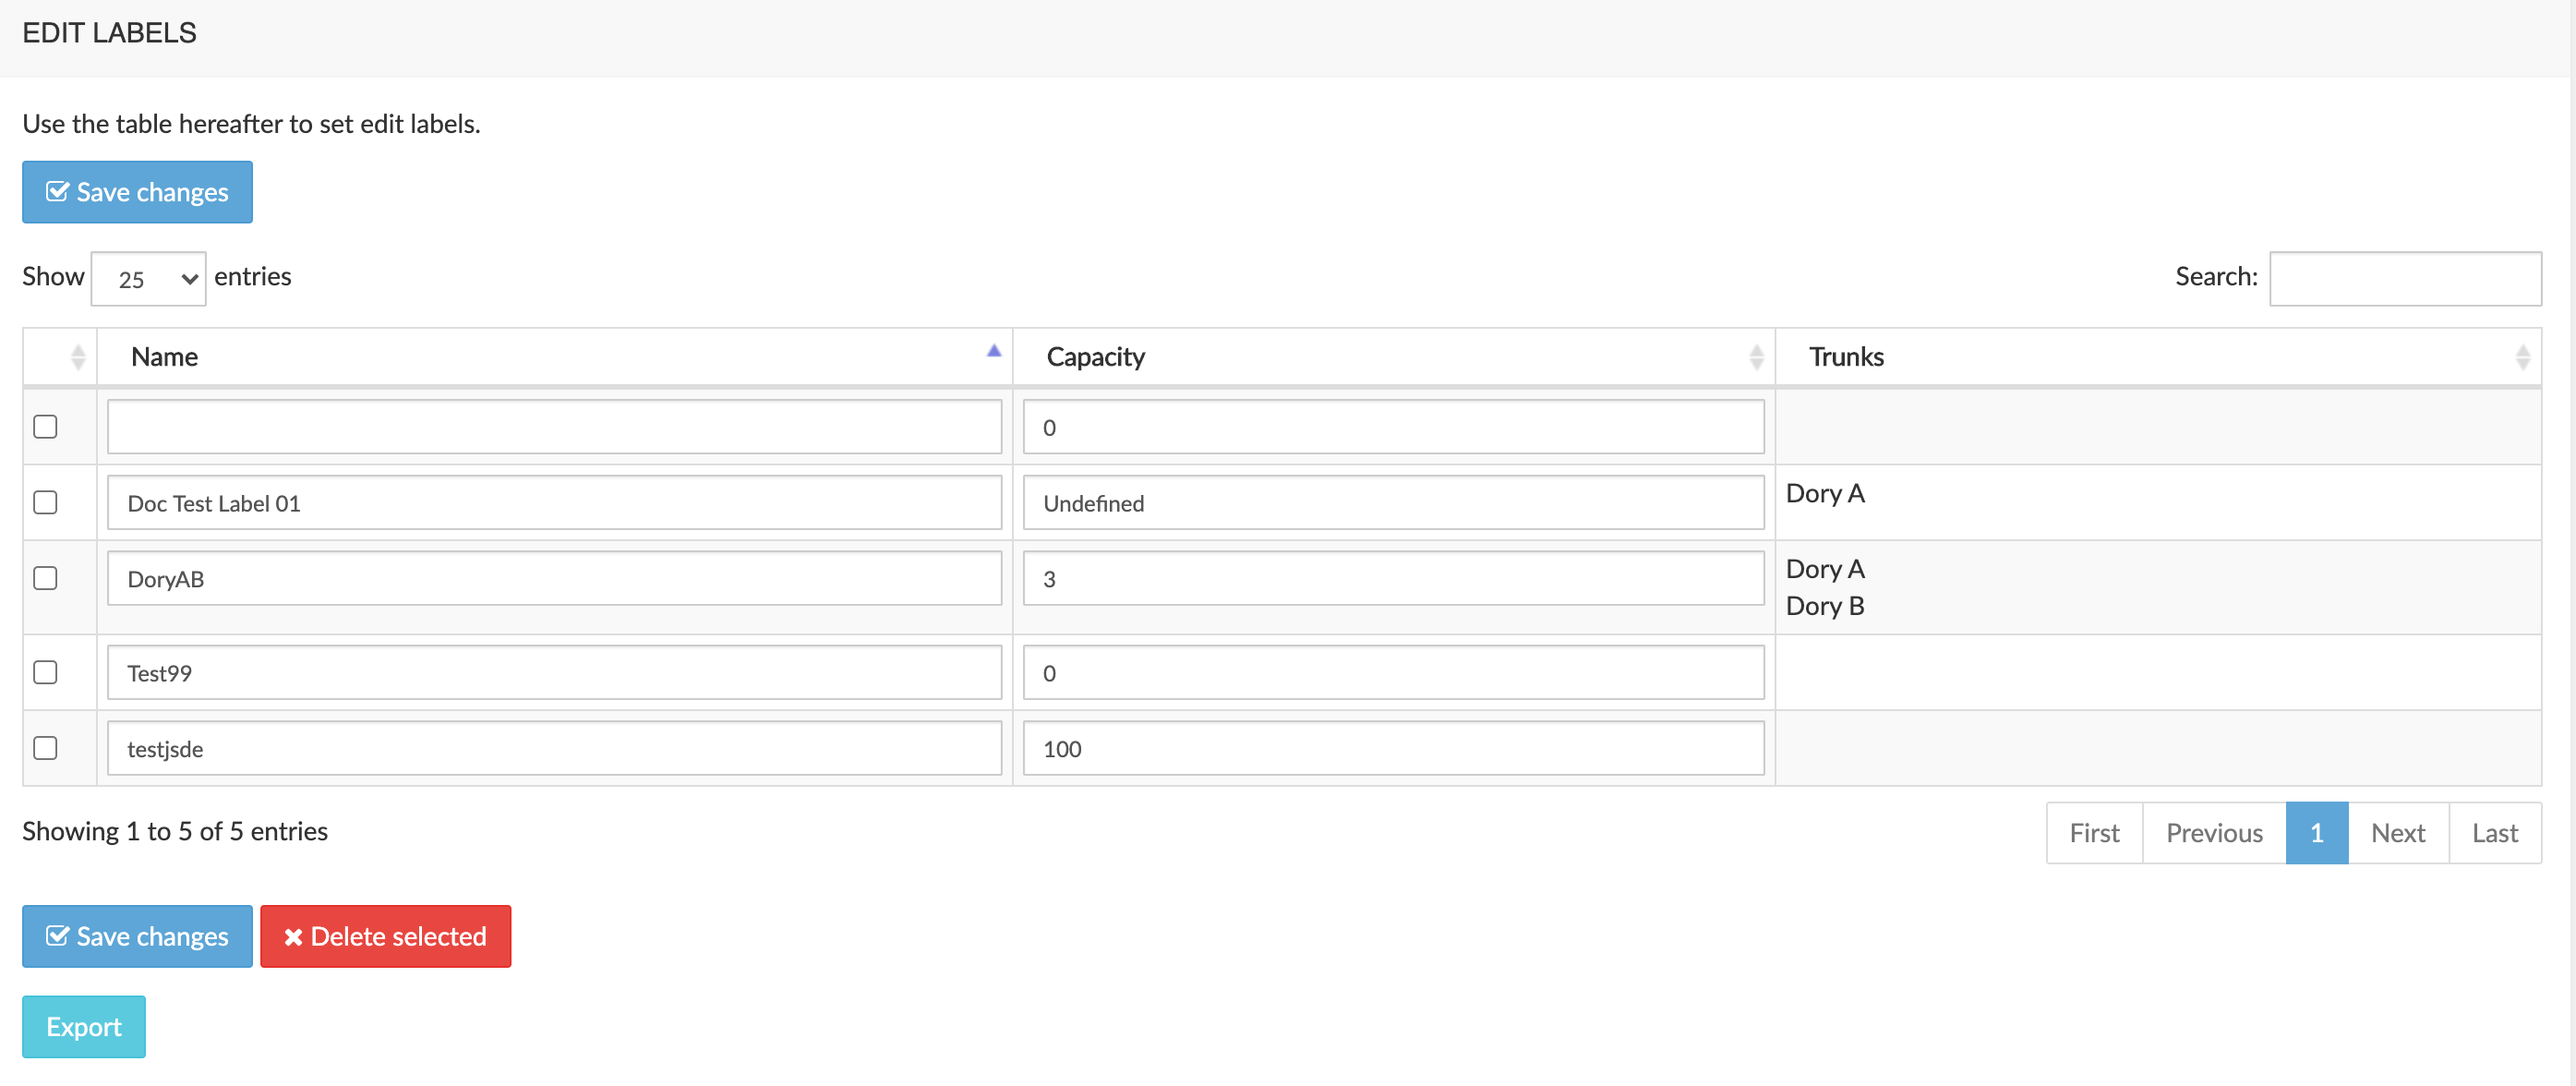
Create a New Label
The Create label section, illustrated below, lets you create a new label by defining its name and capacity. After creation, the label needs to be assigned to one or more realms or endpoints or one or more trunks.

Assign a Label to Groups.
To assign a label:
Select the appropriate tab
Click the check-box next to the objects to which you want to assign a label
Select a label from the drop-down list under the table
Click the Assign label button, as illustrated below.
The newly assigned label will appear in the Labels column.
To deassign a label, click on the X next to it in the Labels column.
Click the Save changes button to store your changes in the database.
[]
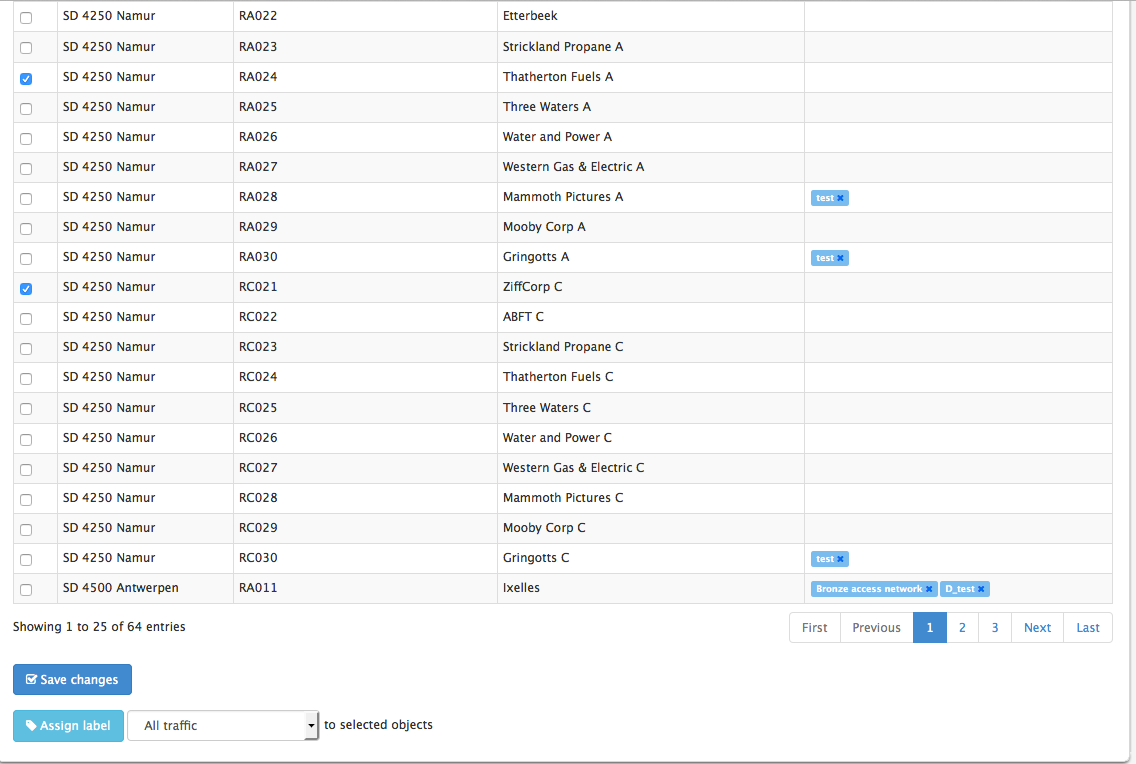
Reports
NEMO can produce downloadable daily, weekly or monthly reports. The report generation system is built on reporting templates that describe what the reports must contain. These reporting templates are then associated to realms, endpoints, labels or ranges.
Two types of reports can be generated: PDF or DOCX. Reports based on the PDF reporting templates offer great portability among platforms, while reports based on DOCX reporting templates are editable and offer great flexibility over the content and look.
The main Reporting Templates browser, illustrated below, lists the reporting templates currently present on the system and provides tools to edit and remove them, and to create new templates.

Create a new PDF reporting template
To create a new PDF reporting template, click the Add new PDF reporting template button. The New Reporting Template menu is displayed.
The Template Properties tab, illustrated below, lets you set or select:
- a name for the reporting template
- the target audience
- the frequency
- the title and subtitle to be used on the generated reports' front pages and page headers.
The Enabled check-box makes this report template available for assignment to a group. See [Assign a Reporting Template to Realms / Endpoints / Ranges, or Labels, or Trunks] for more details.
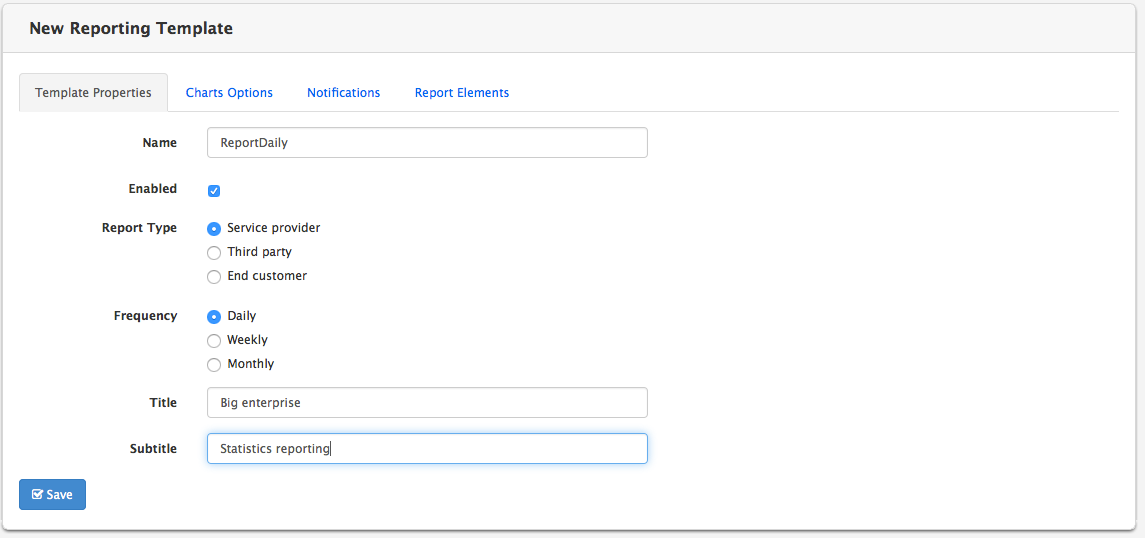
The Charts Options tab, illustrated below, lets you set various options for charts included in the report, such as renaming ingress & egress terms.

The Notifications tab, illustrated below, lets you activate/deactivate the sending of the reports by e-mail. Reports are sent only to users having access to this report and having an e-mail address specified in their User Notification parameter.

The Report Elements tab, illustrated below, lets you select which elements will be present in the report. These can be charts or tables. The table below specifies the type of each element available for selection.
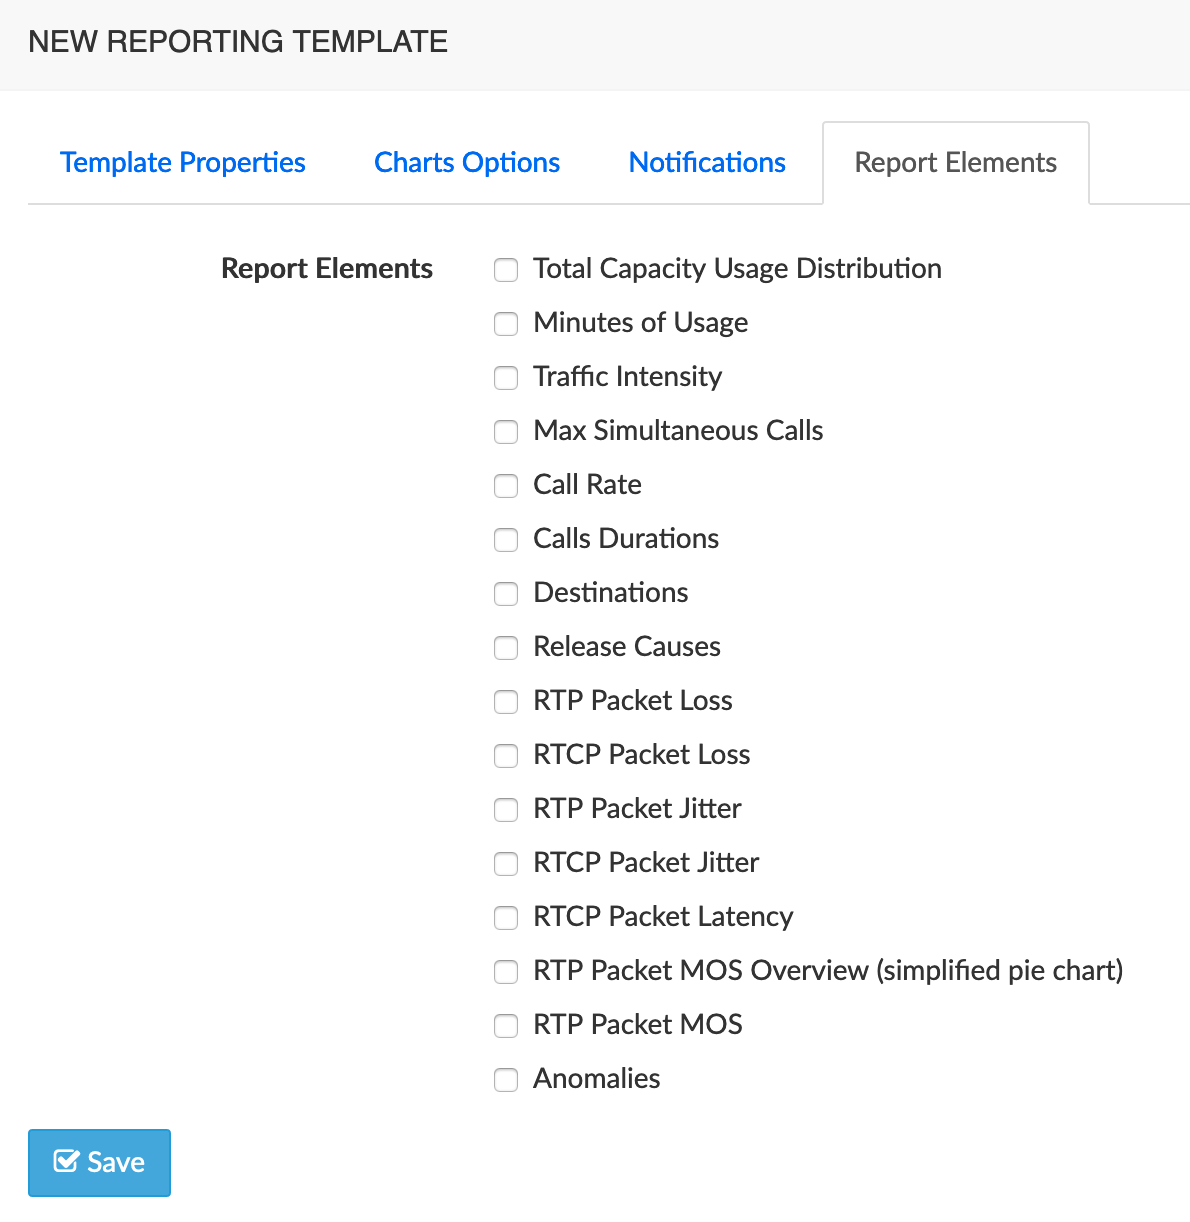
| Element | Type |
|---|---|
| Total Capacity Usage Distribution | pie chart |
| Minutes of Usage | histogram |
| Traffic Intensity | time-based chart |
| Max Simultaneous Calls | time-based chart |
| Call Rate | time-based chart |
| Calls Durations | histogram |
| Destinations | pie chart |
| Release Causes | table |
| RTP Packet Loss | time-based and histogram |
| RCTP Packet Loss | time-based and histogram |
| RTP Packet Jitter | time-based and histogram |
| RCTP Packet Jitter | time-based and histogram |
| RCTP Packet Latency | histogram |
| RTP Packet MOS Overview | pie chart |
| RTP Packet MOS | time-based and histogram |
| Anomalies | table |
: PDF Report Elements - Types
Create a New DOCX Reporting Template
To create a new DOCX reporting template, click the Add new DOCX reporting template button. The New Reporting Template menu is displayed.
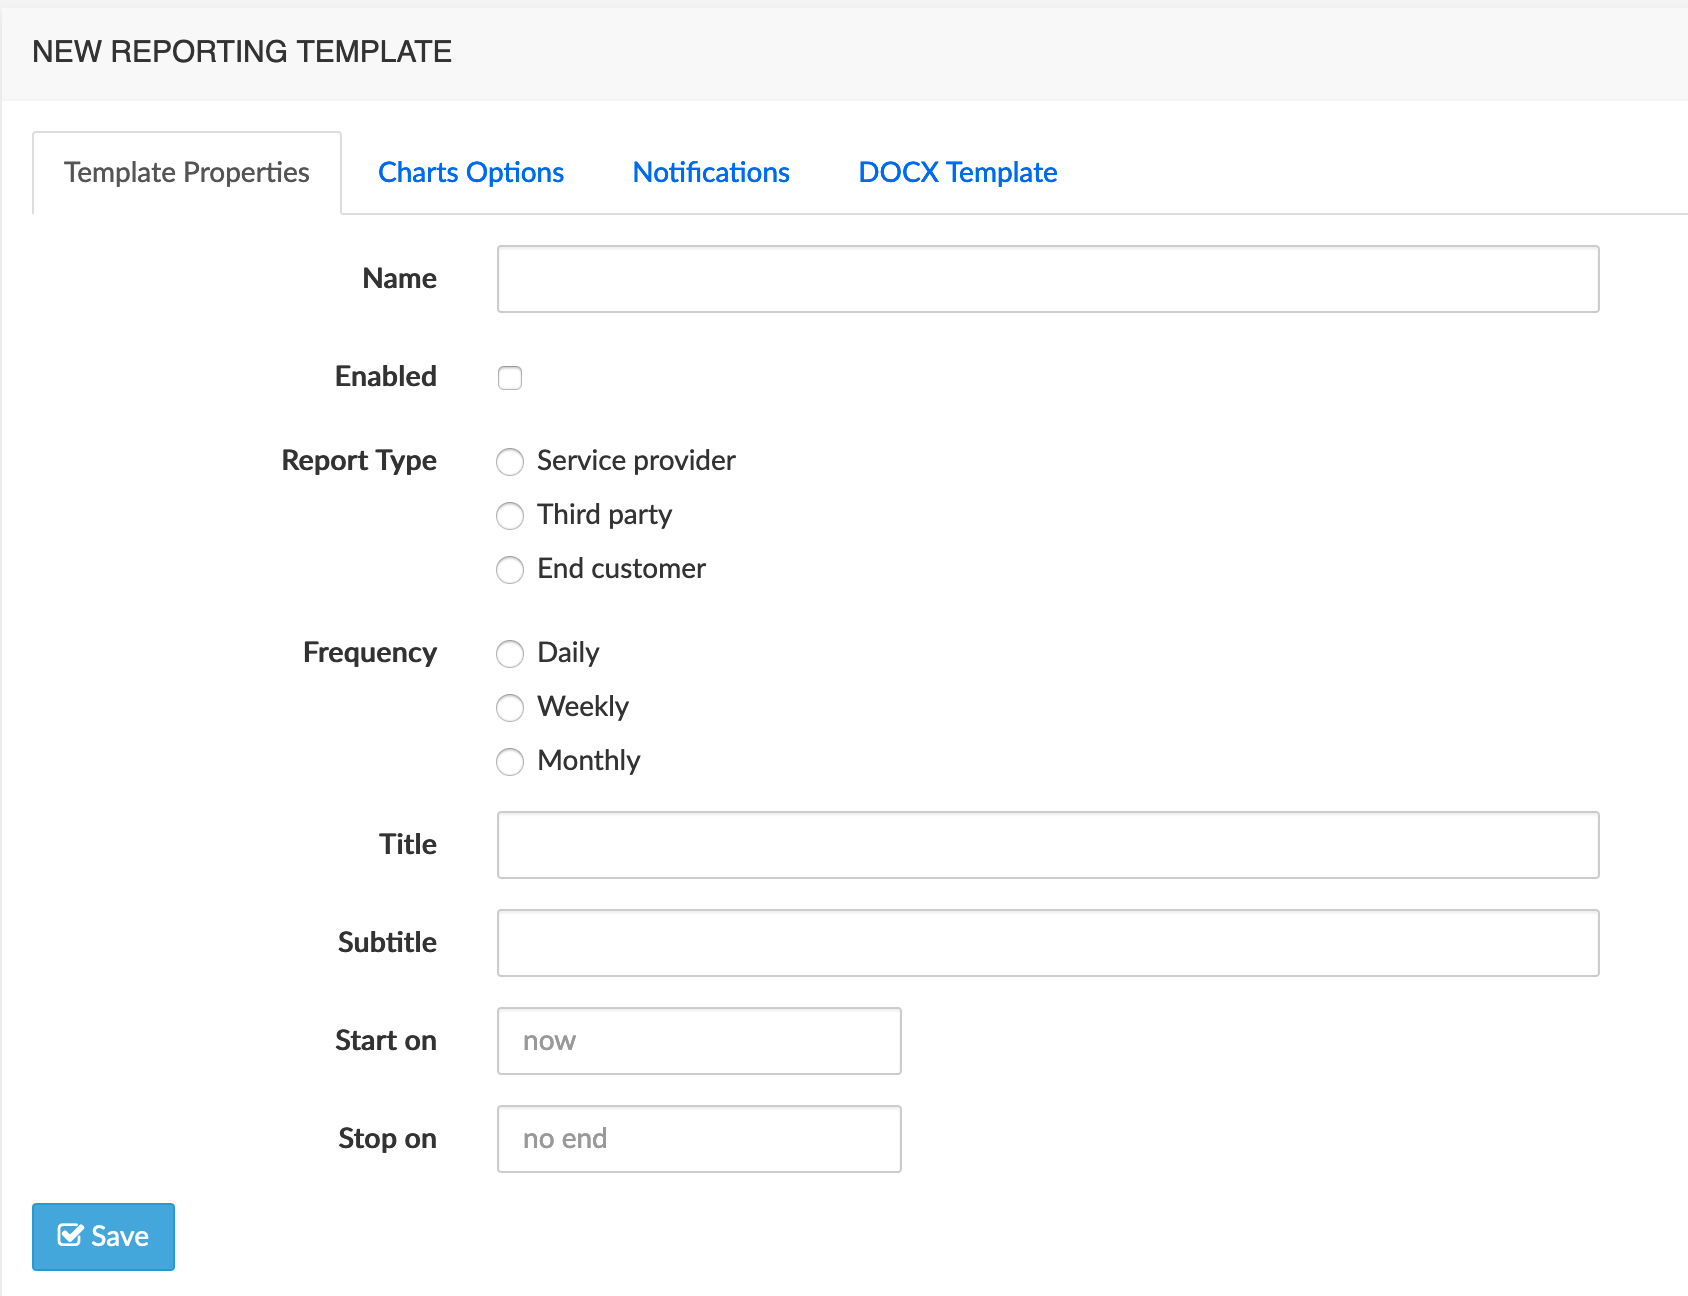
The Template Properties tab, illustrated below, lets you set or select:
- a name for the reporting template
- the target audience
- the frequency
- the title and subtitle to be used on the generated reports' front pages and page headers.
- the starting date for generating the reports
- the date in the future when the reports stop being generated.
The Enabled check-box makes this report template available for assignment to a group. See [Assign a Reporting Template to Groups] for more details.
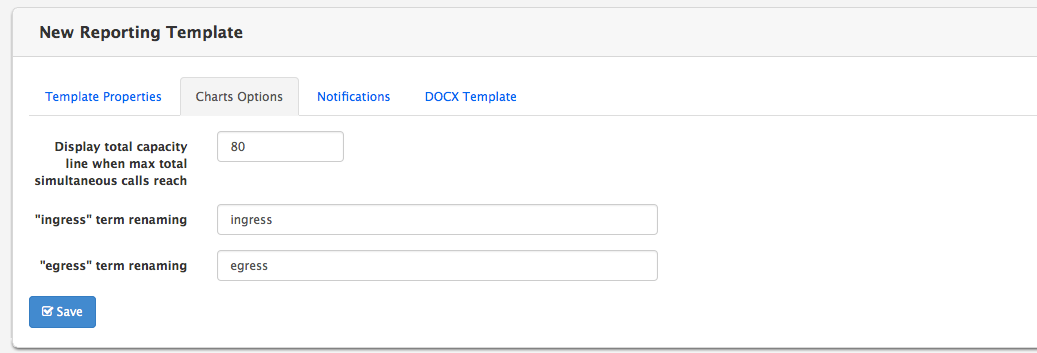
The Charts Options tab, illustrated below, lets you set various options for charts included in the report, such as renaming ingress & egress terms.
The Notifications tab, illustrated below, lets you activate/deactivate the sending of the reports by e-mail. Reports are sent only to users having access to this report and having an e-mail address specified in their User Notification parameter.

The DOCX Template tab, illustrated below, lets you upload a DOCX template that will be used as a basis for the report generation by the system.

Charts and values will replace specific codes, known as placeholders, in the template document. The placeholders supported by the system are listed in the table below.
| Placeholder | Replacement Type | Description |
|---|---|---|
| $title | text | reporting template title |
| $subtitle | text | reporting template subtitle |
| $customerName | text | realm friendly name |
| $realm | text | realm system name |
| $trunkCapacity | text | configured trunk capacity |
| $labelName | text | label name |
| $labelCapacity | text | label capacity |
| $reportFrequency | text | report frequency (daily, weekly or monthly) |
| $period | text | start date -- end date |
| $ingressCallsCount | value | total ingress calls |
| $egressCallsCount | value | total egress calls |
| $totalCallsCount | value | total calls |
| $ingressCallsDuration | value | ingress calls total duration |
| $egressCallsDuration | value | ingress calls total duration |
| $totalCallsDuration | value | calls total duration |
| $ingressCallsAvgDuration | value | average ingress call duration |
| $egressCallsAvgDuration | value | average egress call duration |
| $totalCallsAvgDuration | value | average call duration |
| $ingressMaxIntensity | value | ingress calls max traffic intensity |
| $egressMaxIntensity | value | egress calls max traffic intensity |
| $ingressMaxBHCA | value | ingress calls max BHCA |
| $egressMaxBHCA | value | egress calls max BHCA |
| $totalCapacityWarning | value | warning message if 80% of the configured realm capacity is reached |
| $ingressH323DisconnectCauses | table | table listing the SIP error classes for ingress calls |
| $egressH323DisconnectCauses | table | table listing the SIP error classes for egress calls |
| $ingressSIPStatus | table | table listing the SIP status codes for ingress calls |
| $egressSIPStatus | table | table listing the SIP status codes for egress calls |
| $ingressAvgRTPPacketLoss | value | average ingress packet loss (RTP) |
| $egressAvgRTPPacketLoss | value | average egress packet loss (RTP) |
| $ingressAvgRTCPPacketLoss | value | average ingress packet loss (RTCP) |
| $egressAvgRTCPPacketLoss | value | average egress packet loss (RTCP) |
| $ingressAvgRTPPacketJitter | value | average ingress packet jitter (RTP) |
| $egressAvgRTPPacketJitter | value | average egress packet jitter (RTP) |
| $ingressAvgRTCPPacketJitter | value | average ingress packet jitter (RTCP) |
| $egressAvgRTCPPacketJitter | value | average egress packet jitter (RTCP) |
| $ingressAvgRTCPPacketLatency | value | average ingress packet latency (RTCP) |
| $egressAvgRTCPPacketLatency | value | average egress packet latency (RTCP) |
| $ingressAvgPacketMOS | value | average ingress MOS |
| $egressAvgPacketMOS | value | average egress MOS |
| $graphTotalCapacityUsage | chart | total capacity usage distribution |
| $graphTrafficIntensity | chart | traffic intensity over time |
| $graphMaxSimultaneousCalls | chart | max simultaneous calls over time |
| $graphCallRate | chart | call rate over time |
| $graphConnectionDurations | chart | connection phase duration histogram |
| $graphAlertingDurations | chart | alerting phase duration histogram |
| $graphConnectionDurationsOverTime | chart | Alerting phase duration over time |
| $graphAlertingDurationsOverTime | chart | Alerting phase duration over time |
| $graphHomeDestinations | chart | home network destinations pie |
| $graphInternationalDestinations | chart | international network destinations pie |
| $graphNationalVsInternationalDestinations | chart | Traffic distribution between national and international traffic |
| $graphRTPPacketLossOverTime | chart | packet loss over time (RTP) |
| $graphRTPPacketLossDistribution | chart | packet loss histogram (RTP) |
| $graphRTCPPacketLossOverTime | chart | packet loss over time (RTCP) |
| $graphRTCPPacketLossDistribution | chart | packet loss histogram (RTCP) |
| $graphRTPPacketJitterOverTime | chart | packet jitter over time (RTP) |
| $graphRTPPacketJitterDistribution | chart | packet jitter histogram (RTP) |
| $graphRTCPPacketJitterOverTime | chart | packet jitter over time (RTCP) |
| $graphRTCPPacketJitterDistribution | chart | packet jitter histogram (RTCP) |
| $graphRTCPPacketLatencyDistribution | chart | packet latency histogram (RTCP) |
| $graphIngressPacketMOSSimplifiedPie | chart | MOS overview (ingress media) |
| $graphEgressPacketMOSSimplifiedPie | chart | MOS overview (egress media) |
| $graphPacketMOSOverTime | chart | MOS over time |
| $graphPacketMOSDistribution | chart | MOS histogram |
| $graphIngressCodecsDistribution | chart | Ingress codec pie |
| $graphIngressCodecsDistribution | chart | Egress codec pie |
: DOCX Placeholders
Create a customized PDF report template
In case the customization possible with the two existing types of PDF / DOCX templates described above would not enough match customer needs, Netaxis Solutions Professional Services can develop along customer specifications custom PDF templates totally tailored to meet any need.
Such templates are delivered as zip files ; the Add new customized PDF reporting template tab allows defining the report's properties, chart options, notifications as above, and uploading the template provided by Netaxis.
Assign a Reporting Template to Groups
To assign a Reporting template:
Select the appropriate tab.
Click the check-box next to the groups to which you want to assign a Reporting Template.
Select a Reporting Template from the drop-down list under the table.
Click the Assign Reporting Template button, as illustrated below.
The newly assigned Reporting Template will appear in the Reporting Templates column.
To deassign a Reporting Template, click on the X next to it in the Reporting Templates column.
Click the Save changes button to store your changes in database.
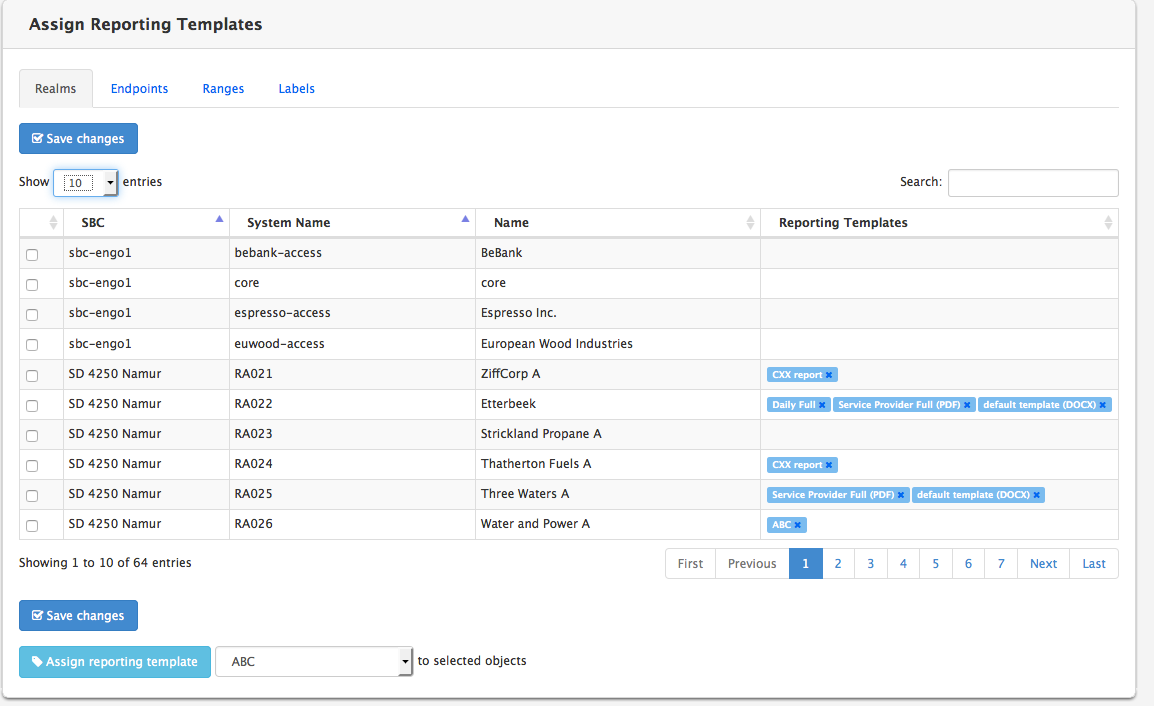
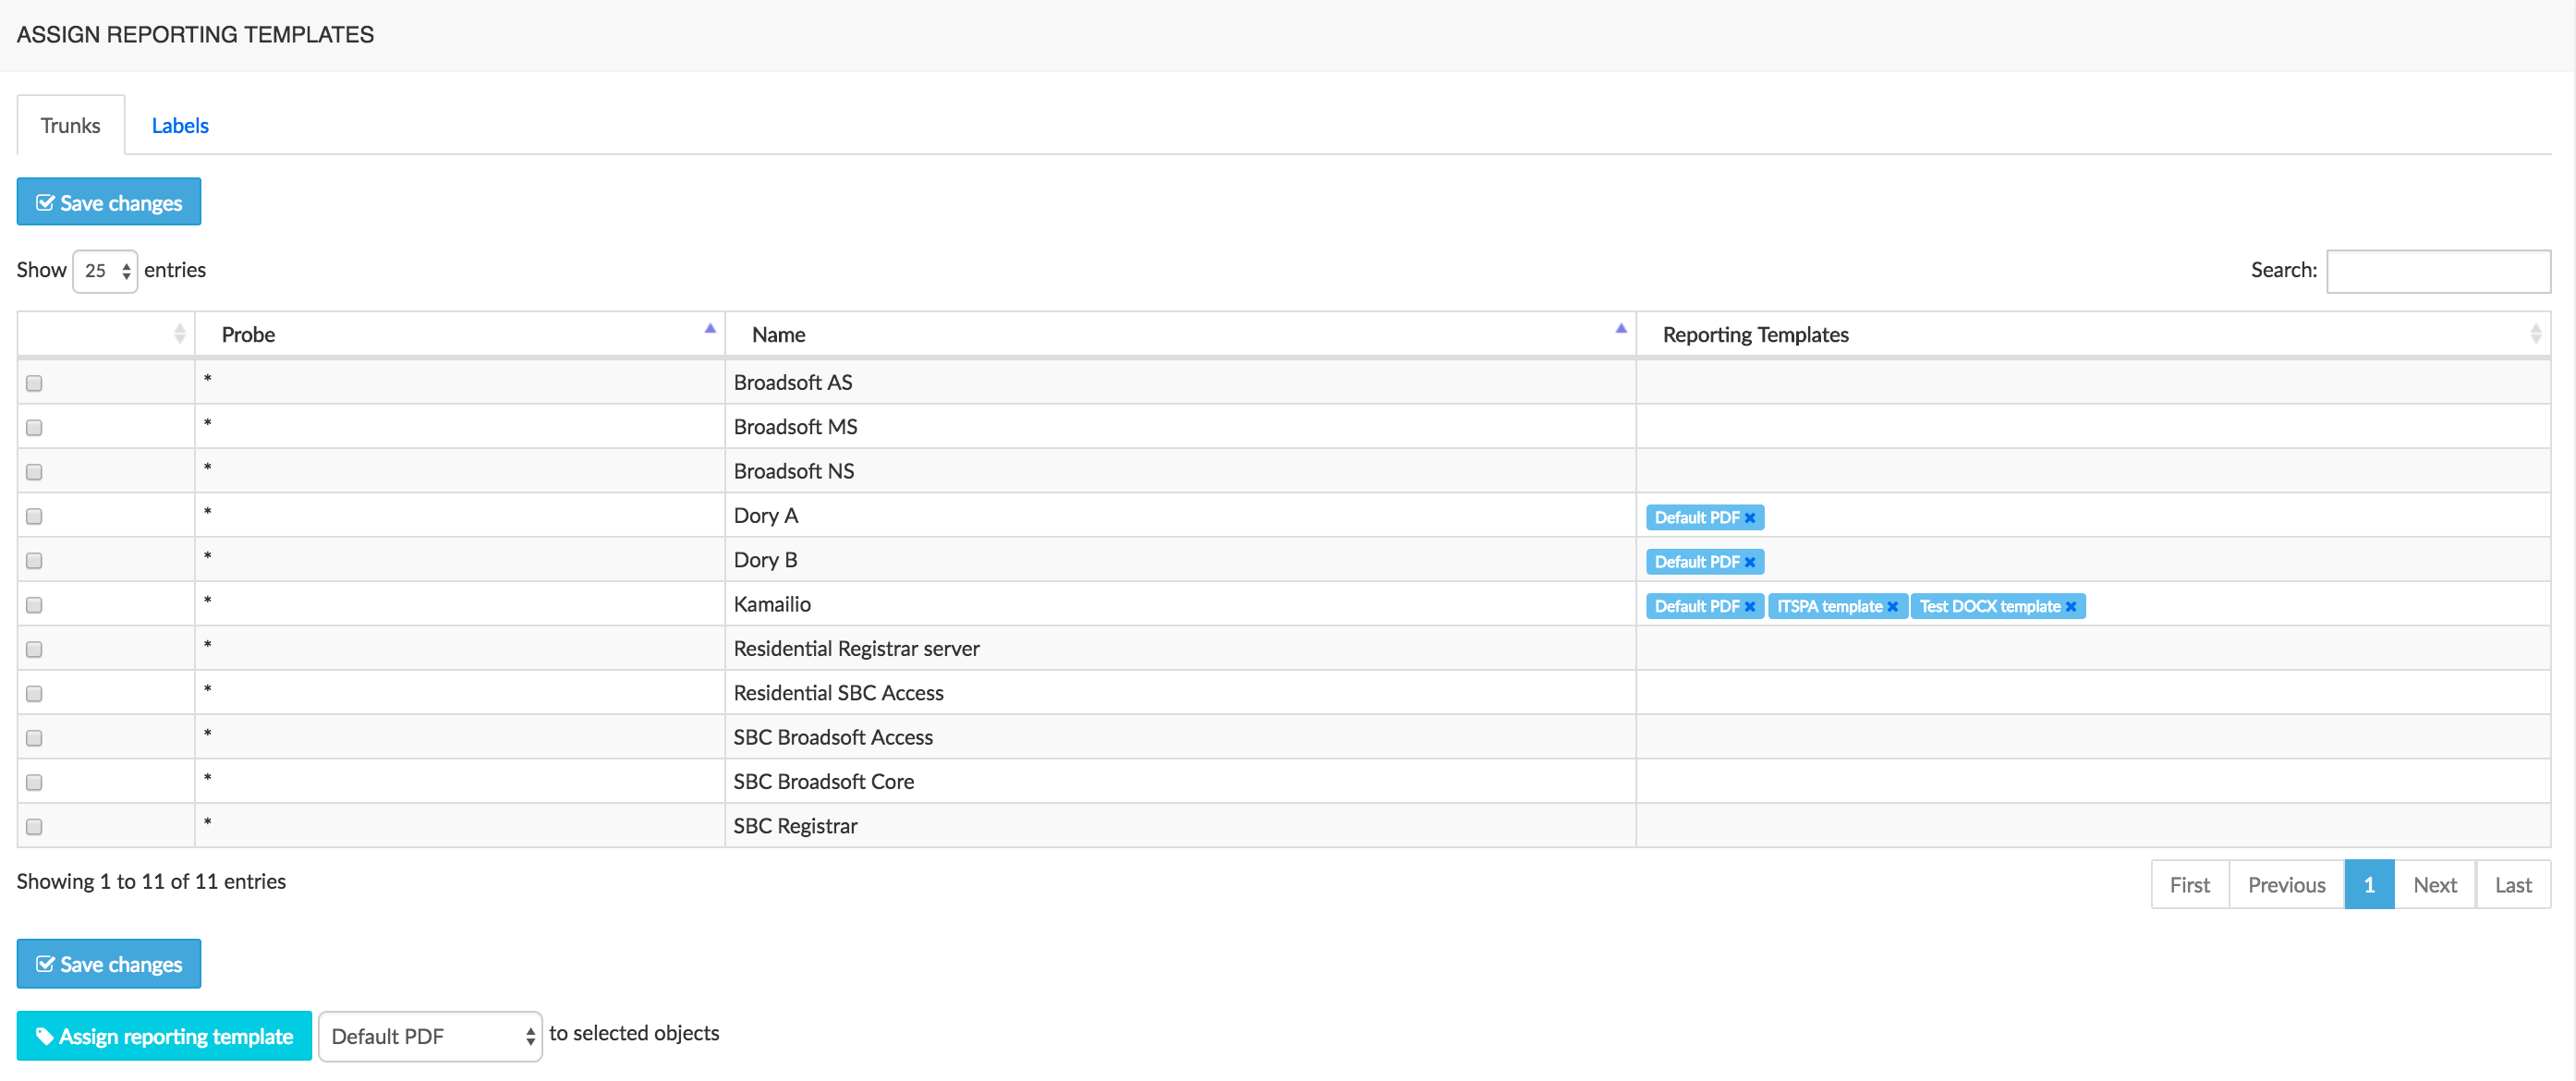
Statistics exports
NEMO offers the possibility to download .csv files containing different statistics computed by NEMO. The .csv files are generated on a daily/weekly/monthly basis and can be retrieved thanks to the Statistics Exports browser. The file generation is based on a profile describing which statistics must be included in the .csv files and for which groups. The files contain 1 value for each statistics and for each group configured.
For instance, if the profile is configured like this:
- Frequency: daily
- Statistics: statistic 1, statistic 2 and statistic 3
- Group: Group 1 and Group 2
then a file will be created every day. This file has 2 rows containing the groups and 3 columns containing the value of the statistics. Note that depending of the statistics selected, the value can be the total, the average or the maximum for the whole day. The main Statistics Export Profiles menu, illustrated below, lists the Statistics export profiles currently present on the system and provides tools to edit and remove them, and to create new profiles.

Create a New Statistics Export Profile
To create a new Statistics export profile, click the Add New statistics export profile button. A new menu is displayed.
The Profile Properties tab, illustrated below, lets you set:
- a name for the statistics export profile
- the frequency of the .csv file production. You can choose between Daily/Weekly/Monthly
- a start date for the .csv file production. The file production can start in the past, in the future, or now.
- If needed, the step interval allows grouping stats in smaller time windows than the global one set in Frequency above. Windows are: default (same as Frequency), 30 mins, 1h, 2h, 4h, 12h, 24h. If a step interval of 1h is set and the frequency is Daily, the exported stats will be split into 24 sections in a single daily file.
- the flag activating the sending of the file by mail. Files are sent only to users having access to this report and having an e-mail address specified in the user notification parameter.
- the flag to activate/deactivate this profile.
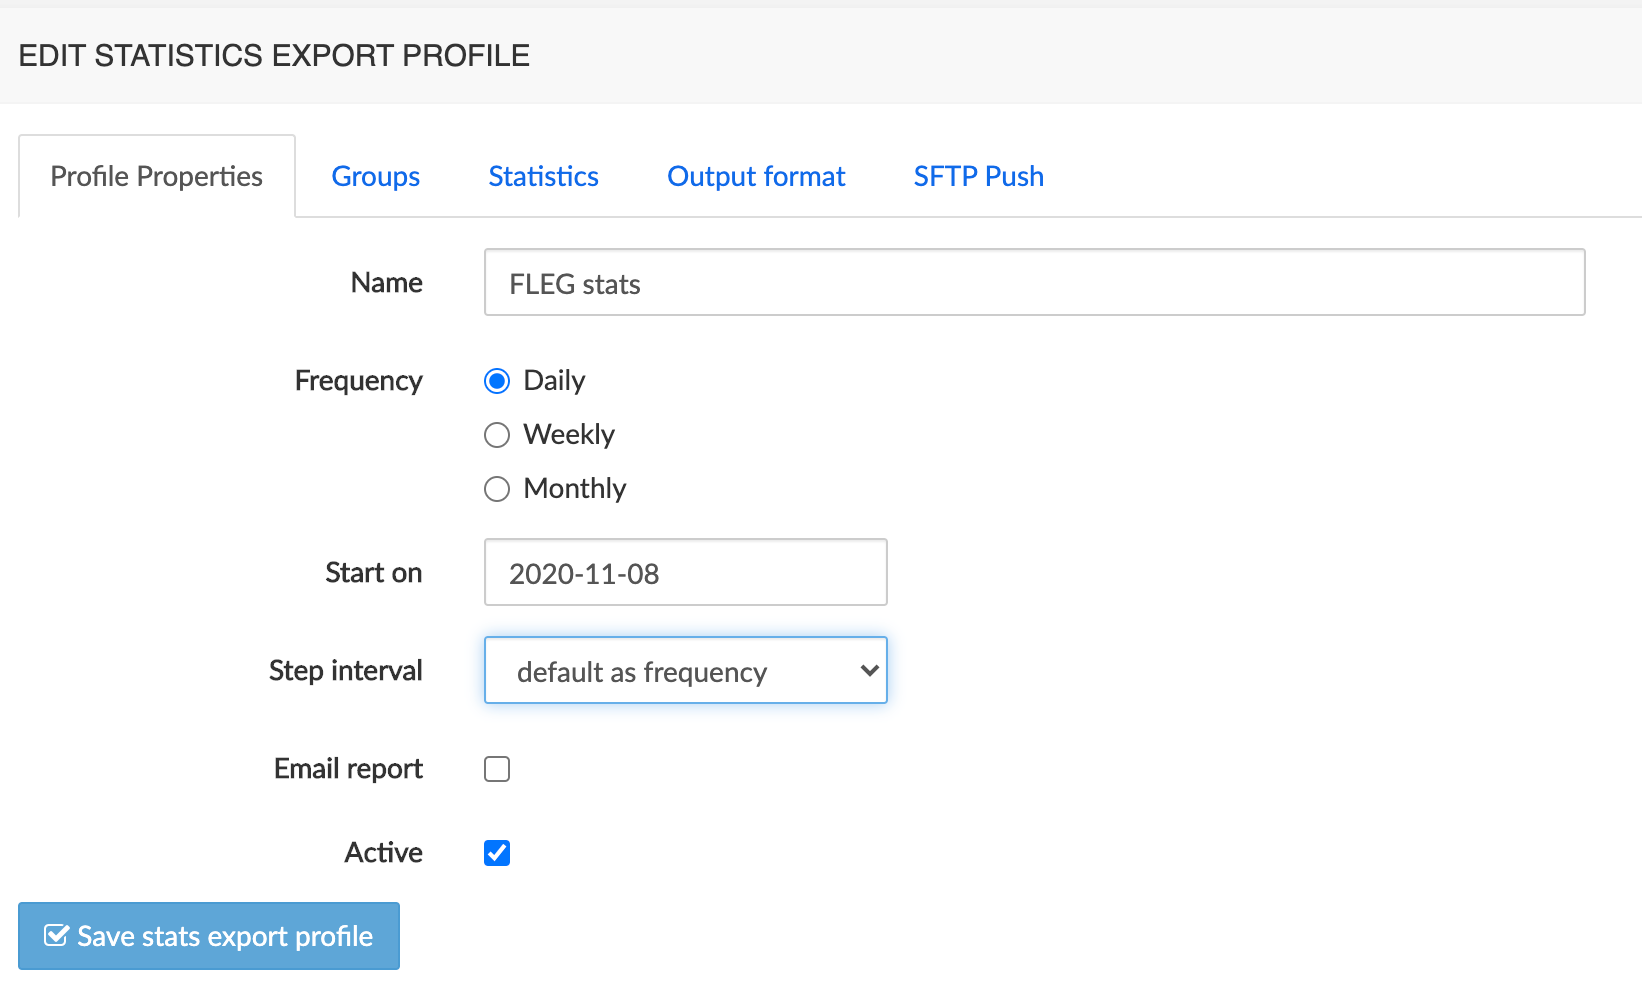
The Groups tab, illustrated below, lets assign groups (of realms, endpoints, ranges, or of trunks, or of labels to the statistics export profile. The .csv file that will be produced will only contain statistics for those groups. Note also that a .csv file will be presented to a user only if this user has access to all the groups configured in the Statistics Export Profile.
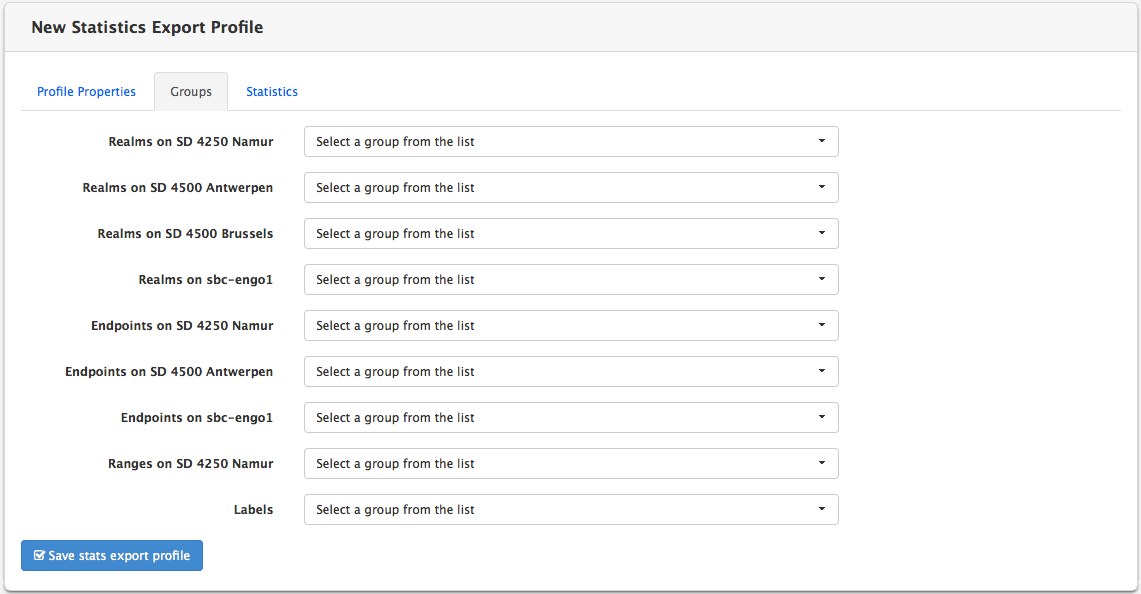

The Statistics tab, illustrated below, lets you selects the statistics that will be present in the .csv file.
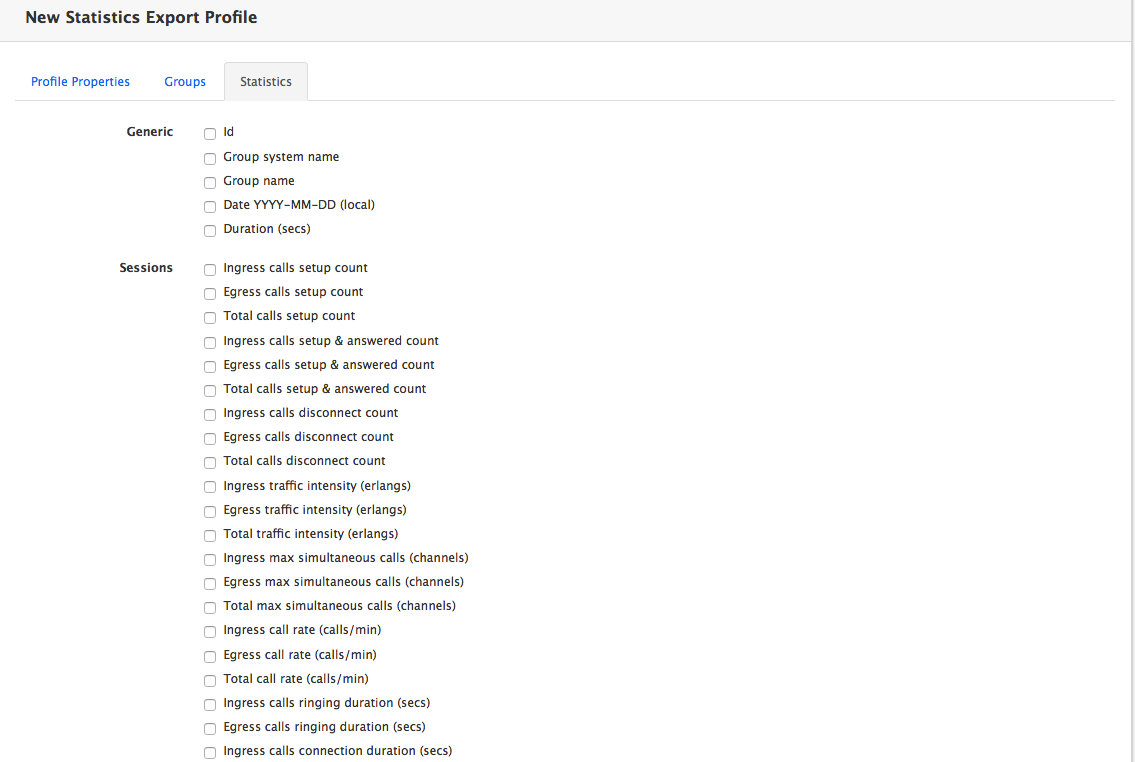
The following statistics are common to all plugins:
- Id
- Group system name
- Group name
- Date YYYY-MM-DD (local)
- hh:mm:ss (local)
- Date YYYY-MM-DD hh:mm:ss (local)
- Duration (secs)
Refer to the chapter [Plugins Features List] for a list of plugin-specific exportable statistics.
The Output format tab allows customizing the CSV delimiter, filename format and compression method to use for the stats export file.
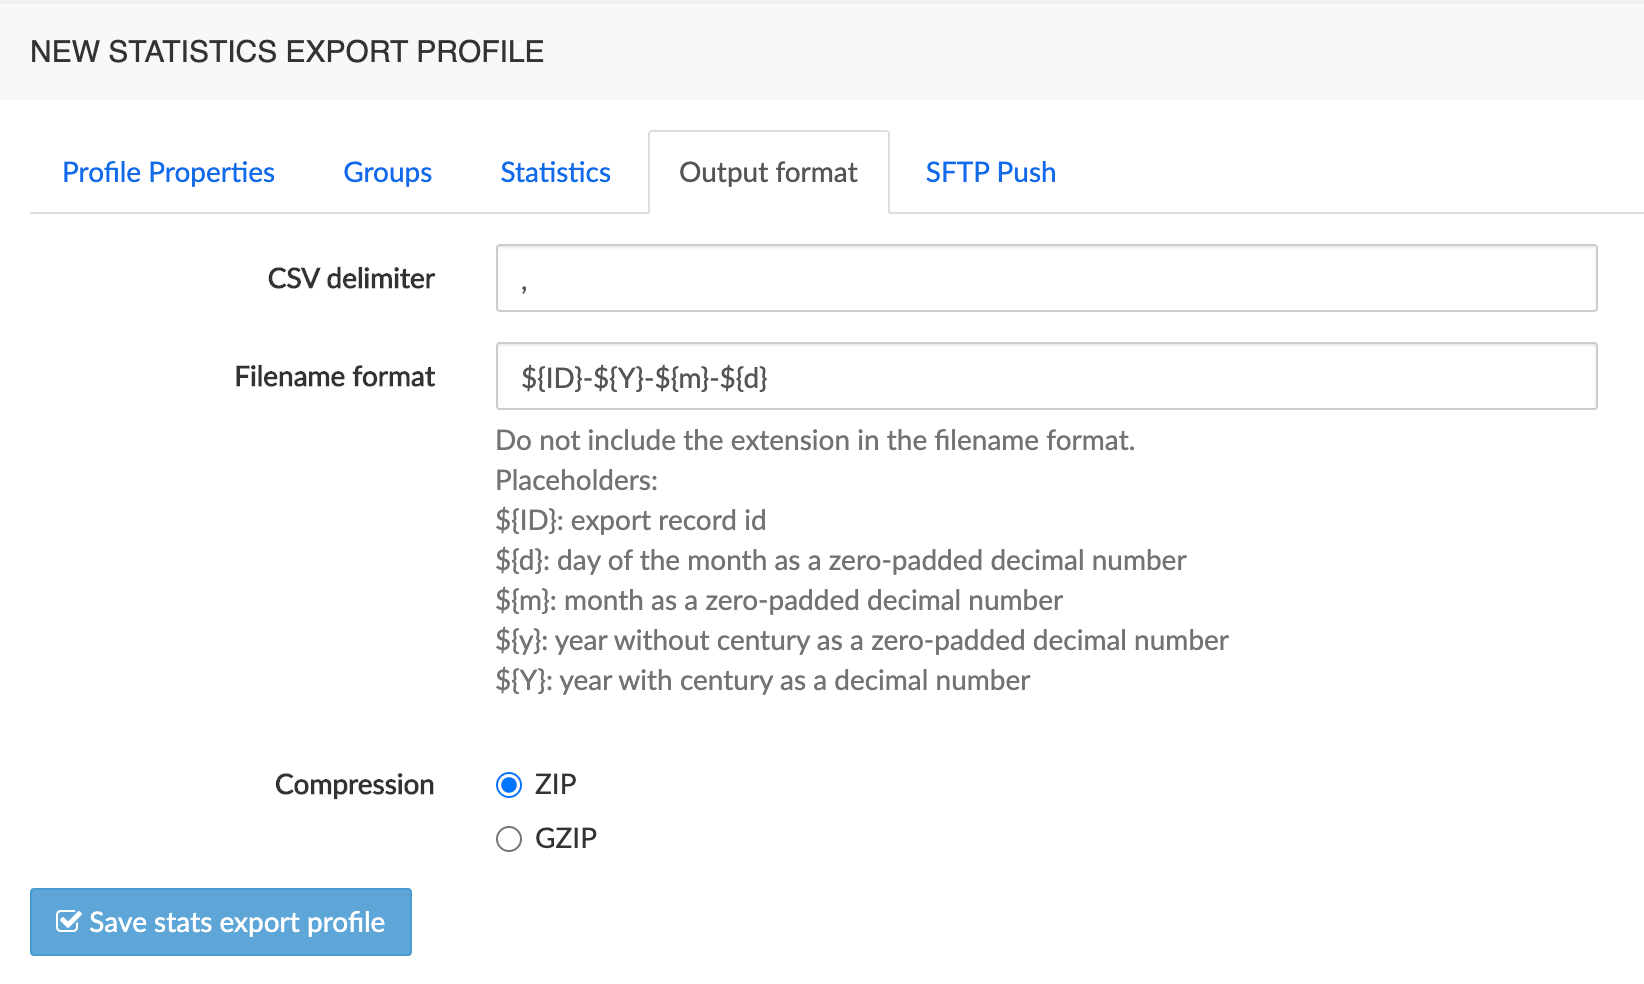
The Push SFTP tab collects the information needed for exporting stats through an SFTP connection.
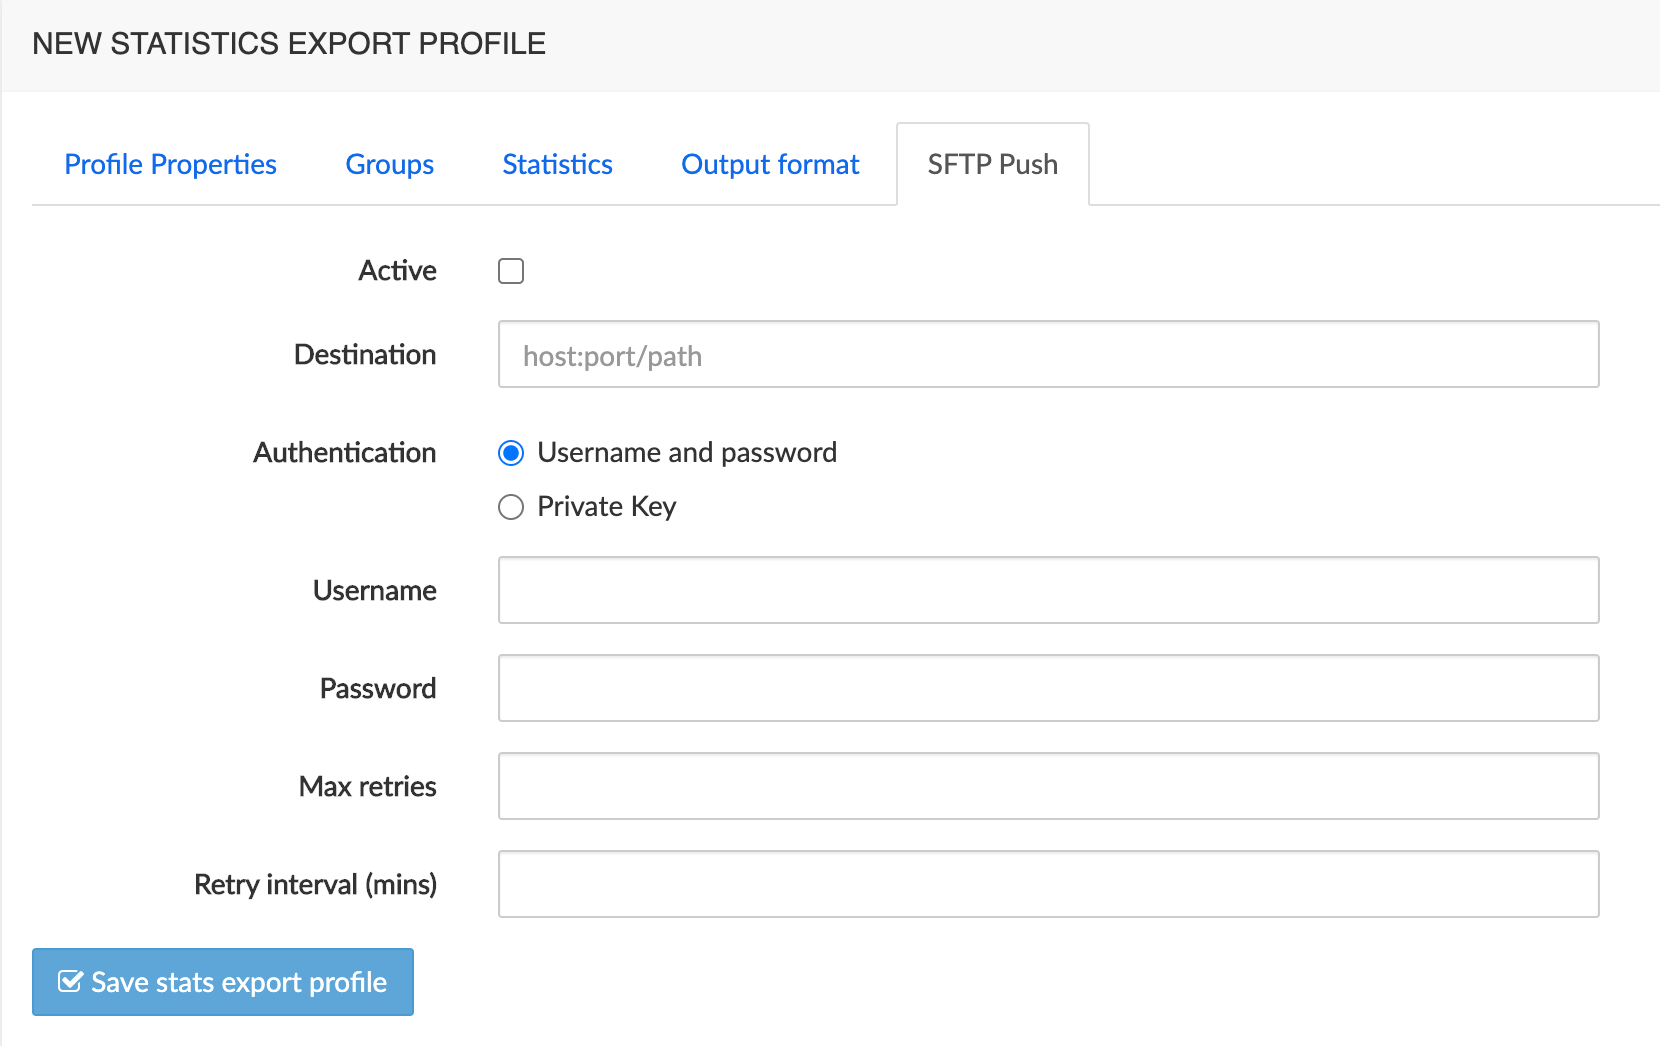
CDR Exports
NEMO offers the possibility to download .csv files containing the CDRs received from the different monitored equipments. The .csv files are generated on a daily basis and can be retrieved thanks to the CDR exports browser. The file generation is based on a profile describing which CDR fields must be included in the .csv file. These profiles are then associated to realms, endpoints, ranges or labels (meaning that .csv files will be produced according to the profile for specific realms/endpoints/ranges/labels).
The main CDR export menu, illustrated below, lists the CDR export profiles currently present on the system and provides tools to edit and remove them, and to create new templates.
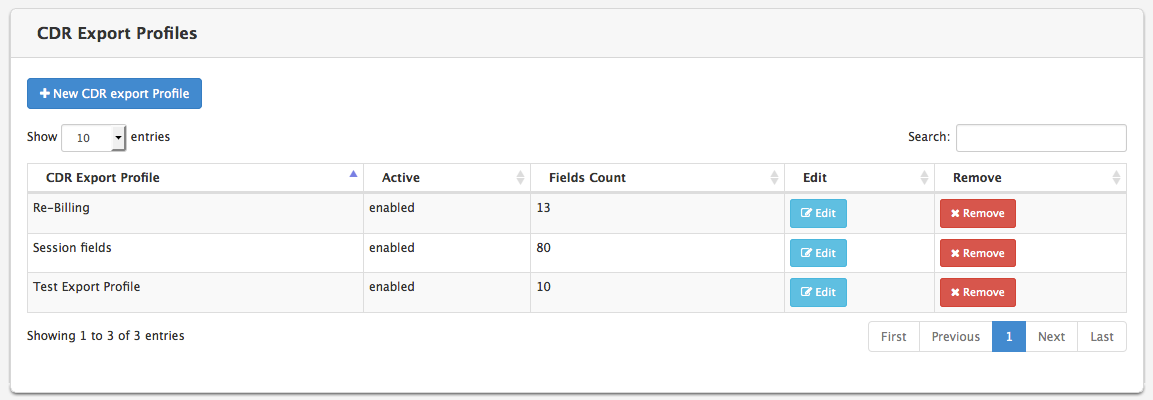
Create a New CDR Export Profile
To create a new CDR export profile, click the New CDR export profile button. A new menu is displayed.
The Profile Properties tab, illustrated below, lets you set a name for the CDR export profile, as well as its status (enabled or not).
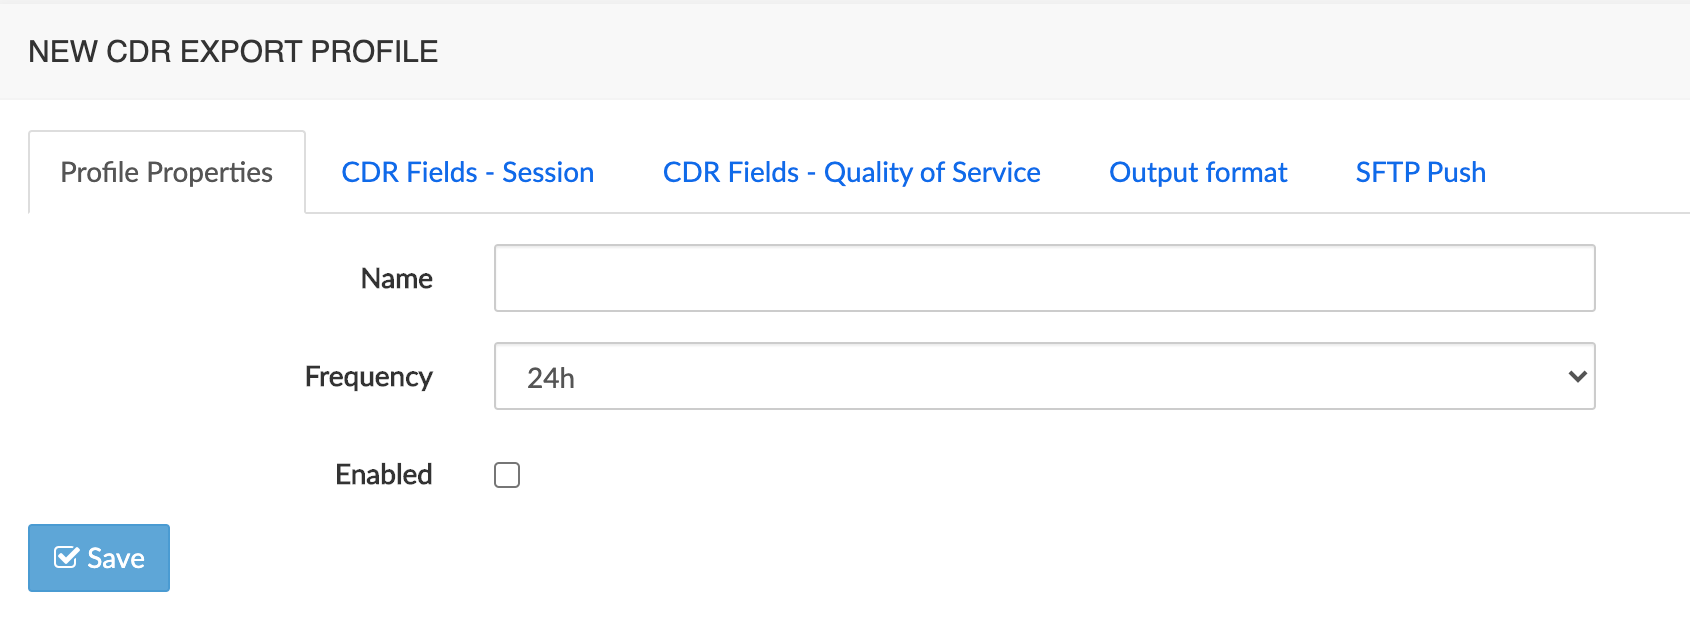
The CDR Fields-Session tab, illustrated below, lets you select the session fields that will be present in the .csv file.
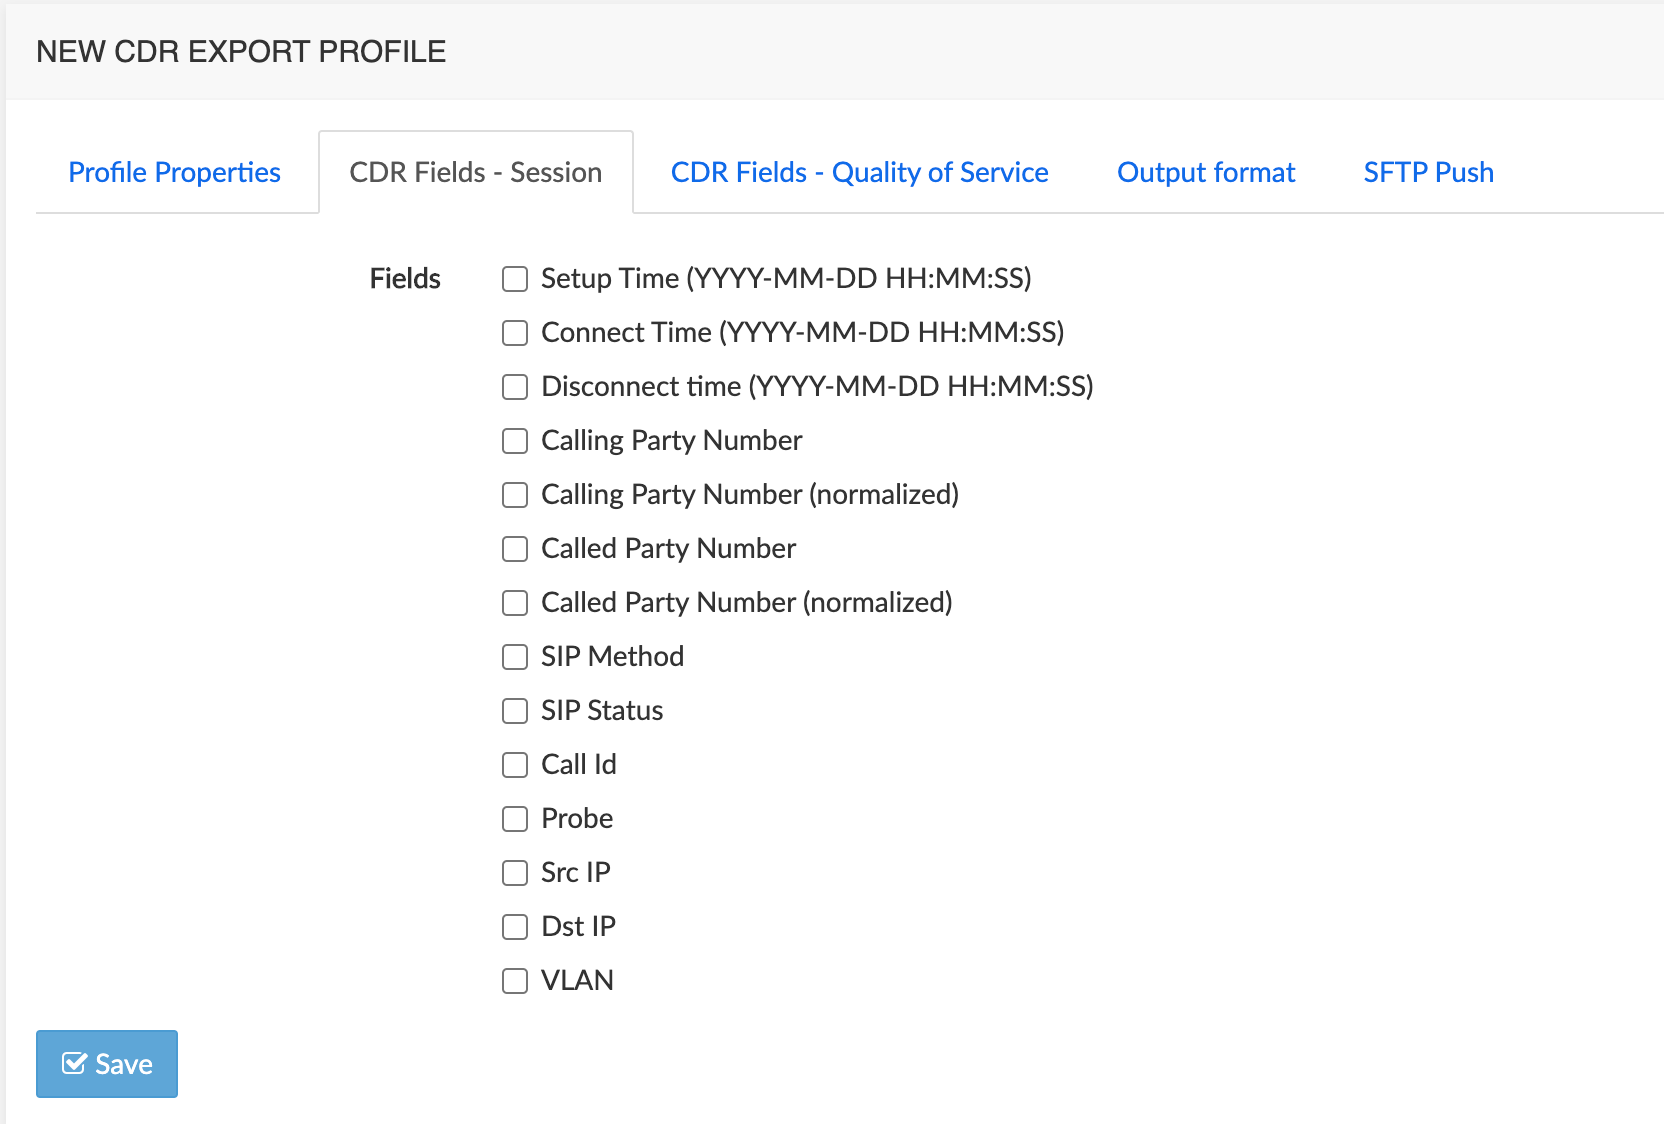
In addition to the session fields, Quality of Service-related fields can be selected the same way.
The Output format tab allows customizing the CSV delimiter, filename format and compression method to use for the CDR export file.
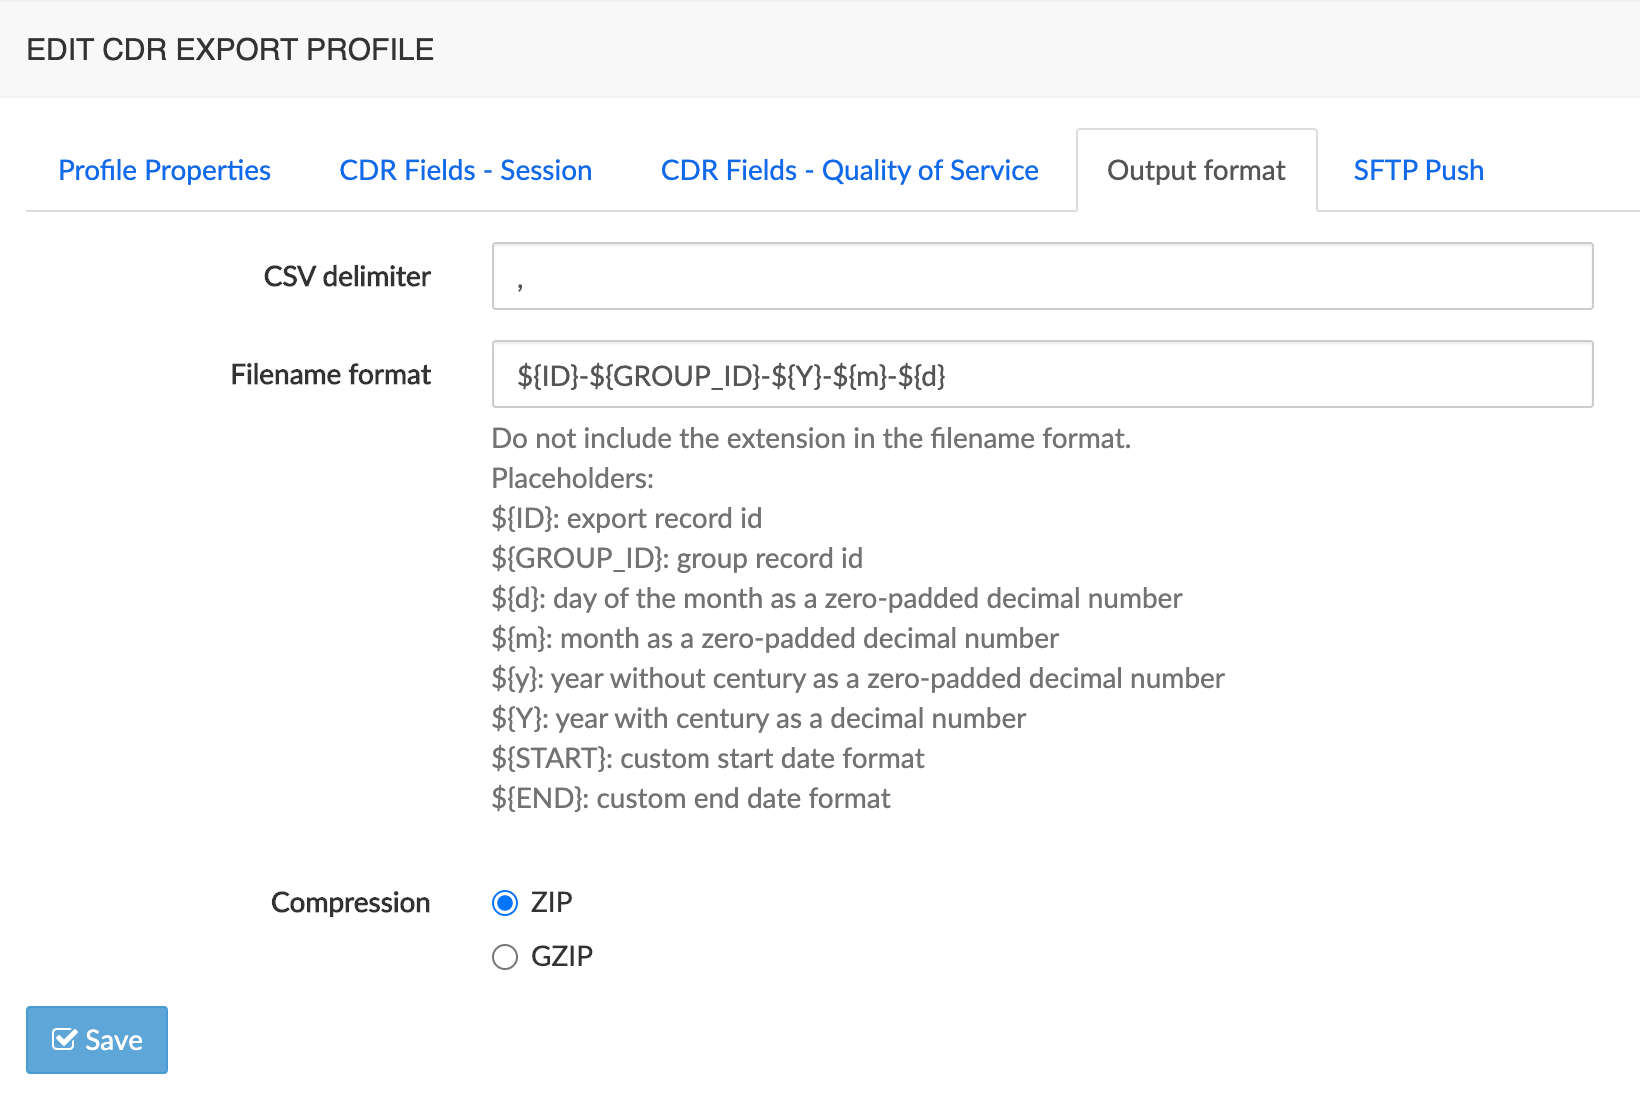
The Push SFTP tab collects the information needed for exporting CDRs through an SFTP connection.

Assign a CDR Export Profile to Groups
To assign a CDR export profile:
Select the appropriate tab.
Click the check-box next to the objects to which you want to assign a "CDR Export Profile".
Select a "CDR Export Profile" from the drop-down list under the table.
Click the Assign CDR Export profile button, as illustrated below.
The newly assigned "CDR Export profile" will appear in the "CDR Export Profiles" column.
To deassign a "CDR Export Profile", click on the X next to it in the "CDR Export Profiles" column.
Click the Save changes button to store your changes in database.
[]
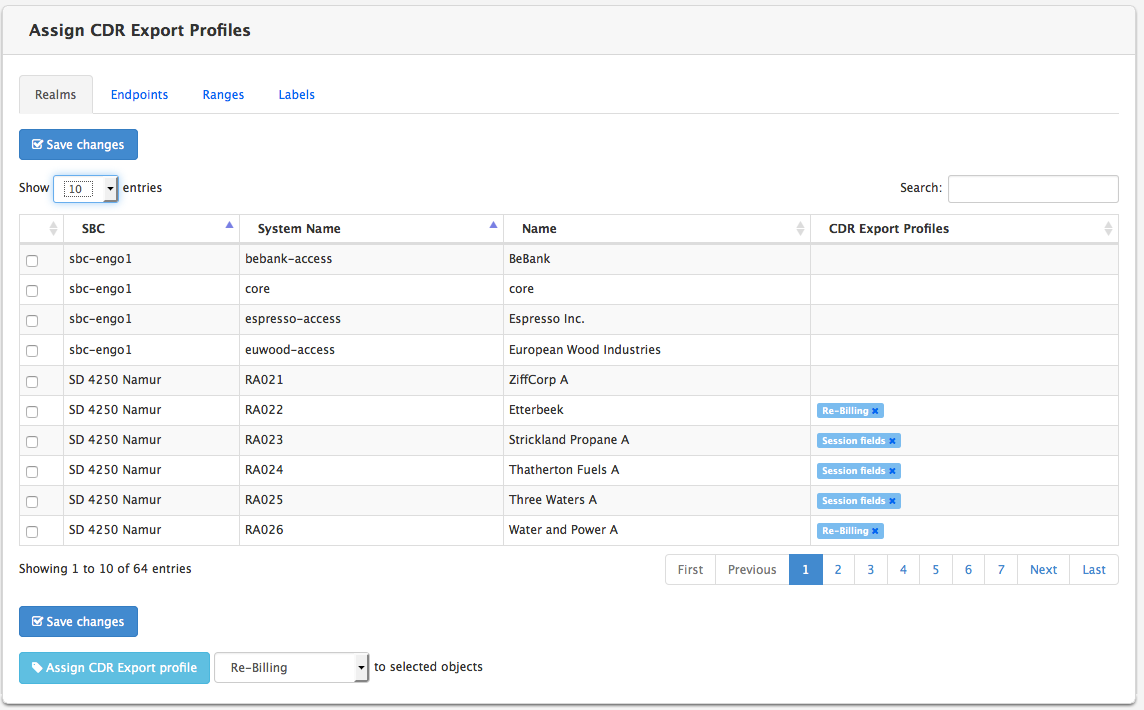
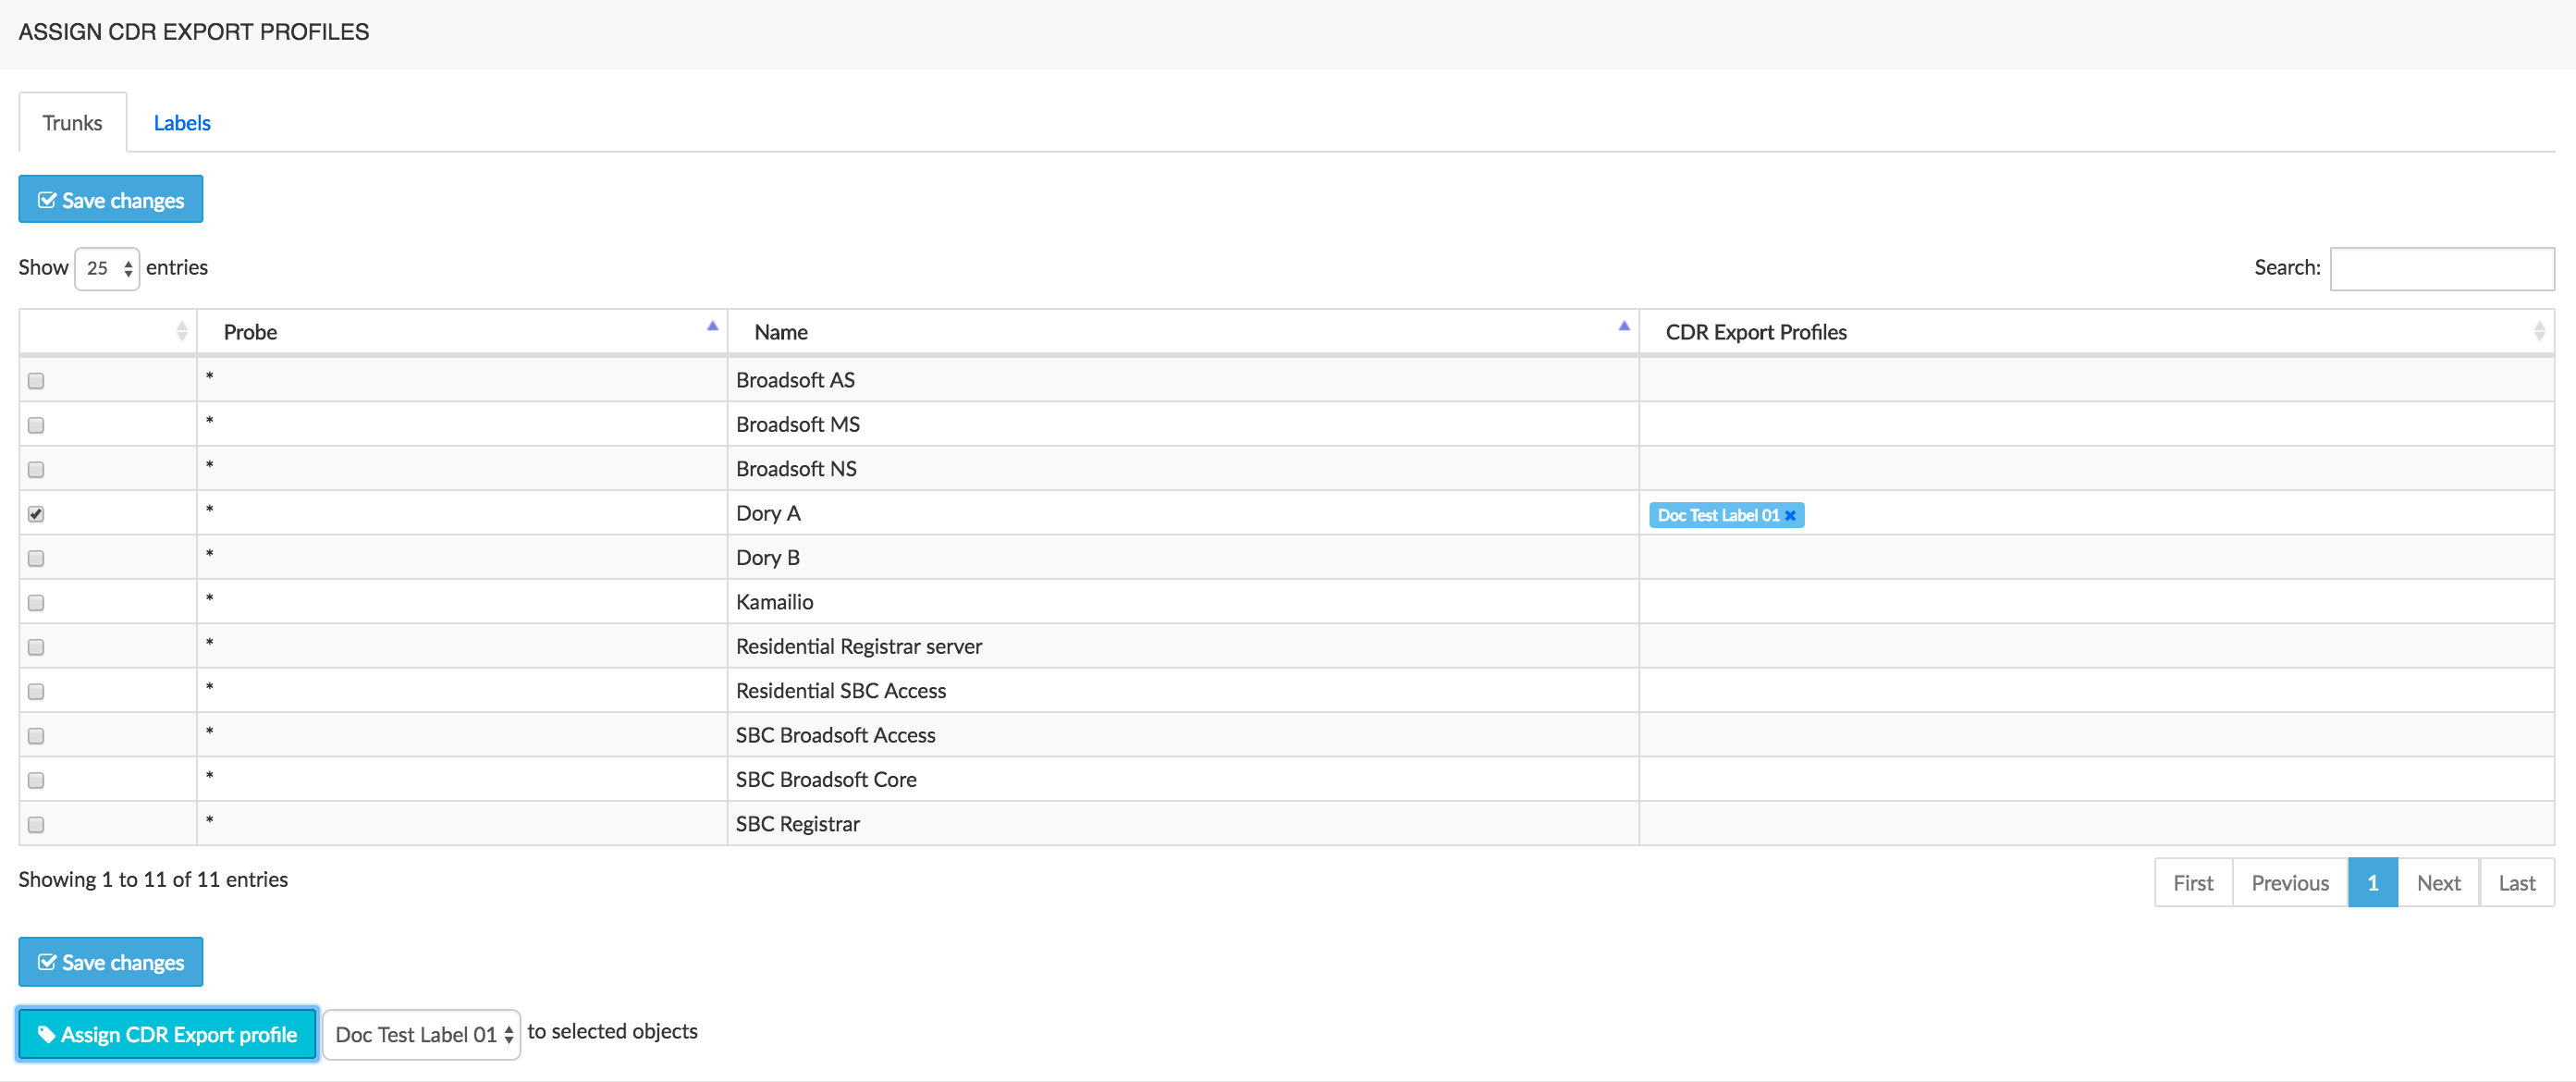
Anomalies
Thanks to its pattern analysis system, NEMO is able to detect anomalies in the network, such as a sudden call rate drop, packet loss over threshold, etc. These anomalies detection rules are described in anomalies profiles, which are then assigned to realms, endpoints, ranges or trunks, or labels to activate the detection of anomalies.
If the VoIP network is heterogeneous, these profiles allow setting different test thresholds depending on the network quality that can be expected.
WARNING
On top of anomalies profiles assignment, the Anomalies Engine must be running for the detection to be active. Please contact Netaxis support if anomalies are not detected after an Anomalies Profile has been assigned to your groups.
The anomalies profiles currently provisioned on the system are listed in the Anomalies Profile main menu, illustrated below.
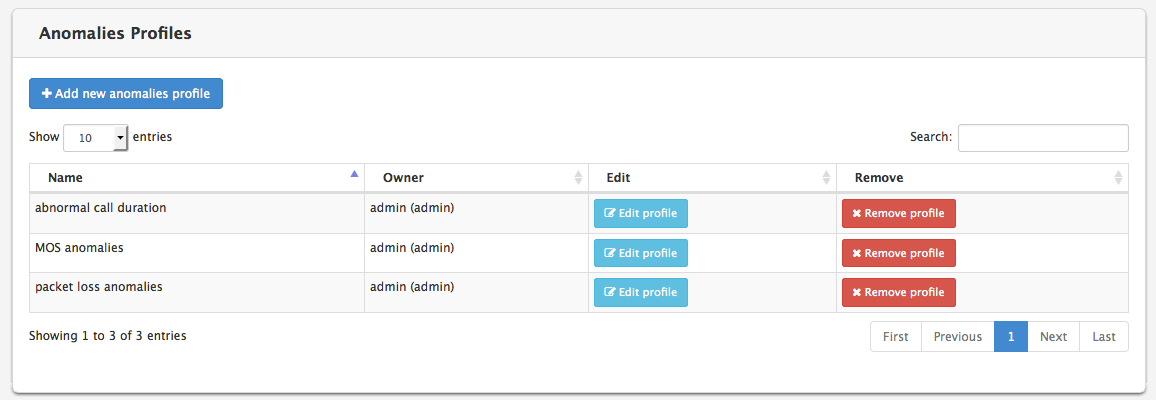
Create a new Anomalies Profile
Click on the Add new anomalies profile button to create a new anomalies profile. The New Anomalies Profile menu shows up, as illustrated below.
The Profile Properties tab allows defining:
- The name for this new anomalies profile
- Whether or not to also send the anomalies as SNMP notifications
- The IP address of the network management system (NMS)
- The SNMP community name to be used in the SNMP protocol
- The IP address of the second network management system (NMS), if any
- The SNMP community name to be used in the SNMP protocol for the second SNMP connection.
- Whether or not to also send the anomalies as e-mail notifications
- Whether or not to also send the anomalies as SMS notifications.
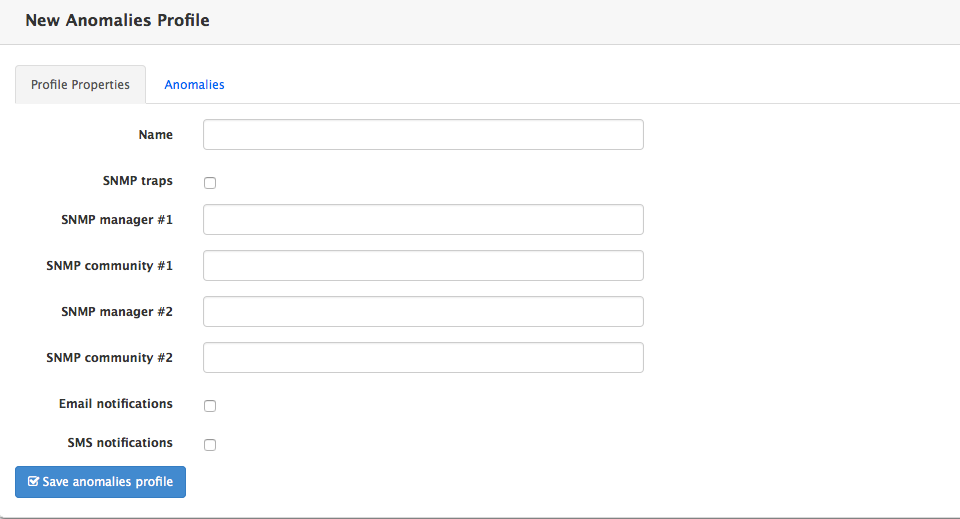
An Anomalies profile can contain several anomalies and an anomaly can be defined using a set of up to five conditions. The Anomalies tab, illustrated below, lists the already defined anomalies, if any, and lets you create new anomalies.

Click on the New Anomaly button to create an anomaly. The Anomaly Definition menu shows up, as illustrated below. This menu allows defining:
- The name of the anomaly
- A description
- The severity (informational, warning, minor, major, critical)
- The observation window for anomalies detection. (For example, if observation window is set to 5 minutes and the condition is that MOS score must be above 4, then NEMO computes the average MOS score by 5-minute slots and will produce an alarm only if this average is higher than 4).
- The active/inactive status
- The set of conditions (up to five)
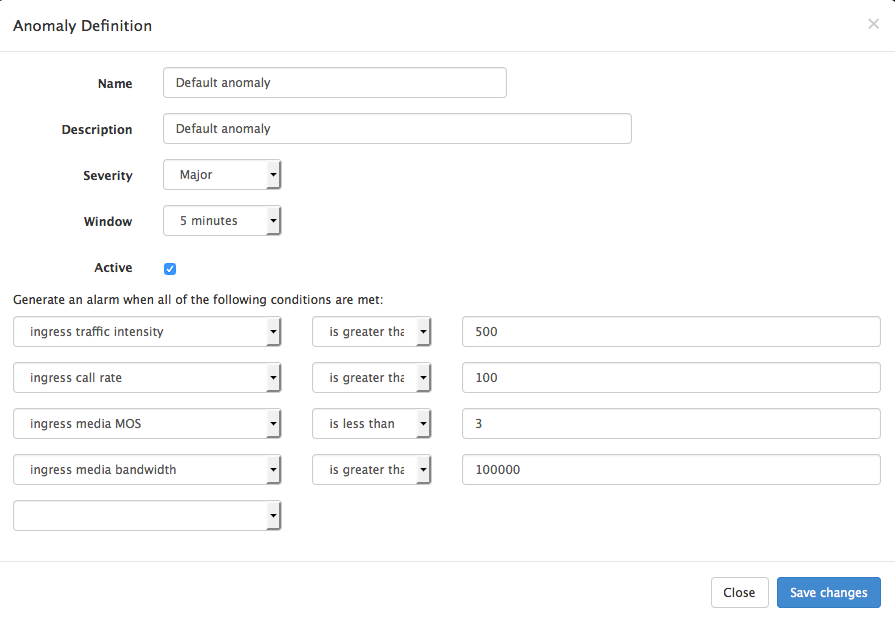
The following conditions are available to define anomalies.
The tables below list the conditions available for all plugins.
| Condition Type | Operator | Parameters |
|---|---|---|
| Day of week | is/is not | Mon, Tue, Wed, Thu, Fri, Sat, Sun |
| Time of day | is between/is not between | Configurable time range |
| ingress [custom metric] | is less than/is greater than | depending on metric type |
| egress [custom metric] | is less than/is greater than | depending on metric type |
Refer to the chapter [Plugins Features List] for a list of plugin-specific anomaly tests.
Edit an Anomalies Profile
To edit an anomalies profile, click on the Edit anomalies profile link illustrated in [Anomalies Profiles list].
Remove an Anomalies Profile
To remove an anomalies profile, click on the Remove anomalies profile link illustrated in [Anomalies Profiles list].
Assign an Anomalies Profile to Groups
To assign an Anomalies Profile:
Select the appropriate tab.
Click the check-box next to the objects to which you want to assign an Anomalies Profile.
Select an Anomalies Profile from the drop-down list under the table.
Click the Assign Anomalies profile button, as illustrated below.
The newly assigned Anomalies profile will appear in the Anomalies Profiles column.
To deassign an Anomalies Profile, click on the X next to it in the Anomalies Profiles column.
Click the Save changes button to store your changes in database.
[]
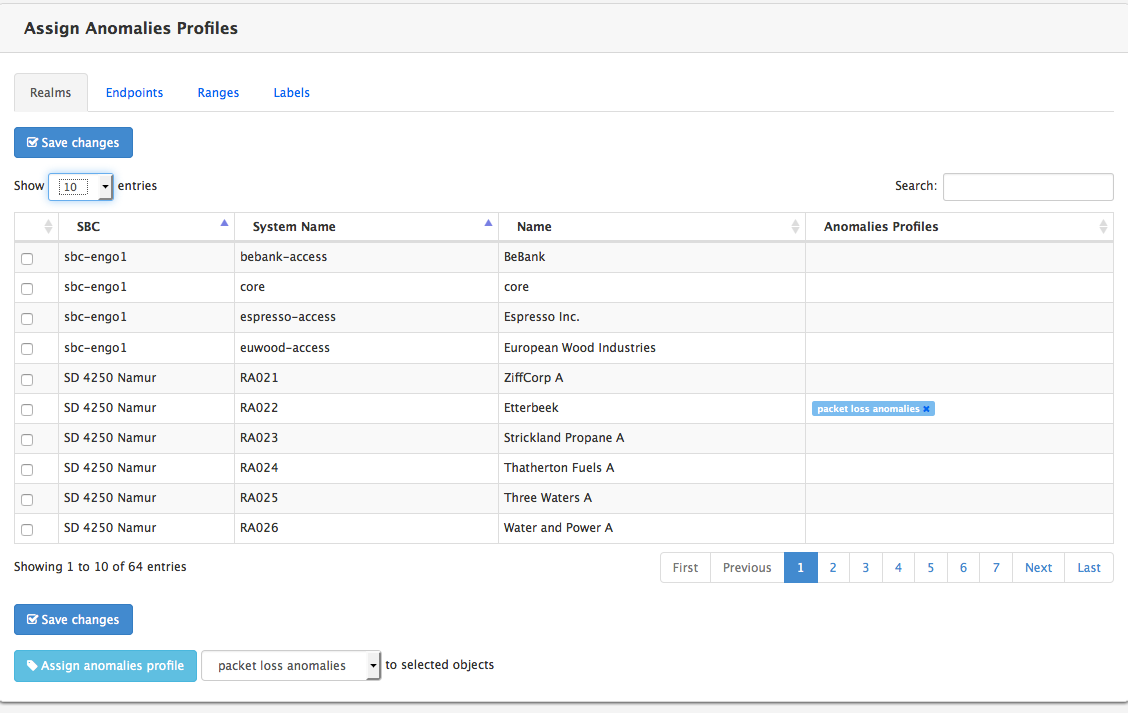
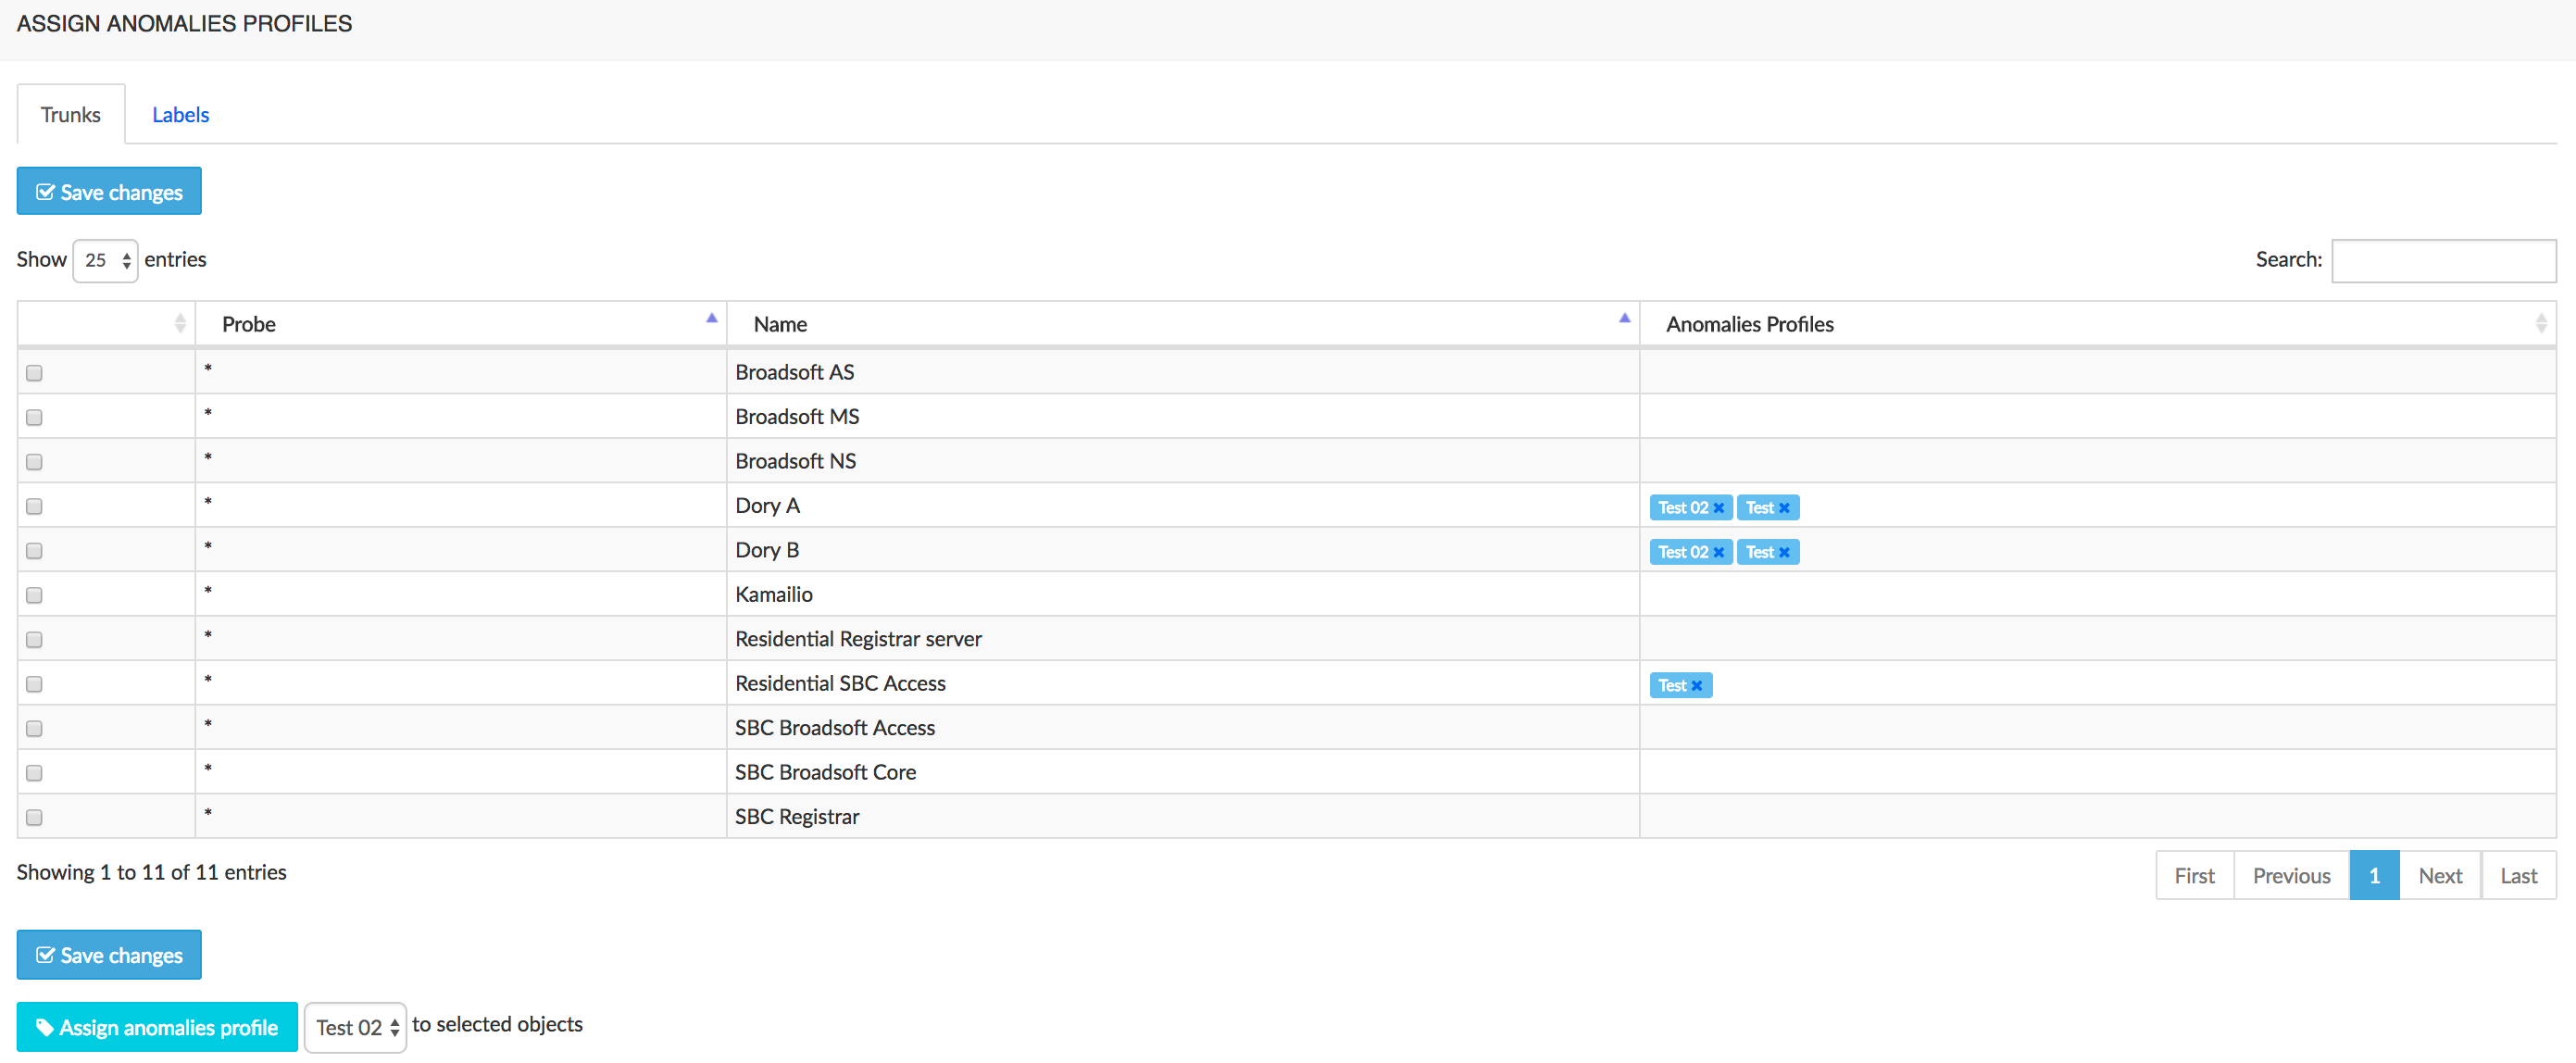
SNMP
NEMO manages the SNMP events emitted by the monitored equipments, converts them into alarms and displays them in the [SNMP Alarms] browser window. This is achieved thanks to SNPM rules, which allow selecting existing traps (and events) from the SNMP MIBs available to NEMO, and customizing their descriptions into understandable messages.
The SNMP Rules Set browser window, illustrated below, shows the rules currently defined. Each existing rule can be edited (click Edit button) or removed (click Remove button).

Create an SNMP Rule
To create a rule and add it to the set of rules, click the Add New Rule button. This opens the New SNMP Rule: Step 1 window, illustrated below.
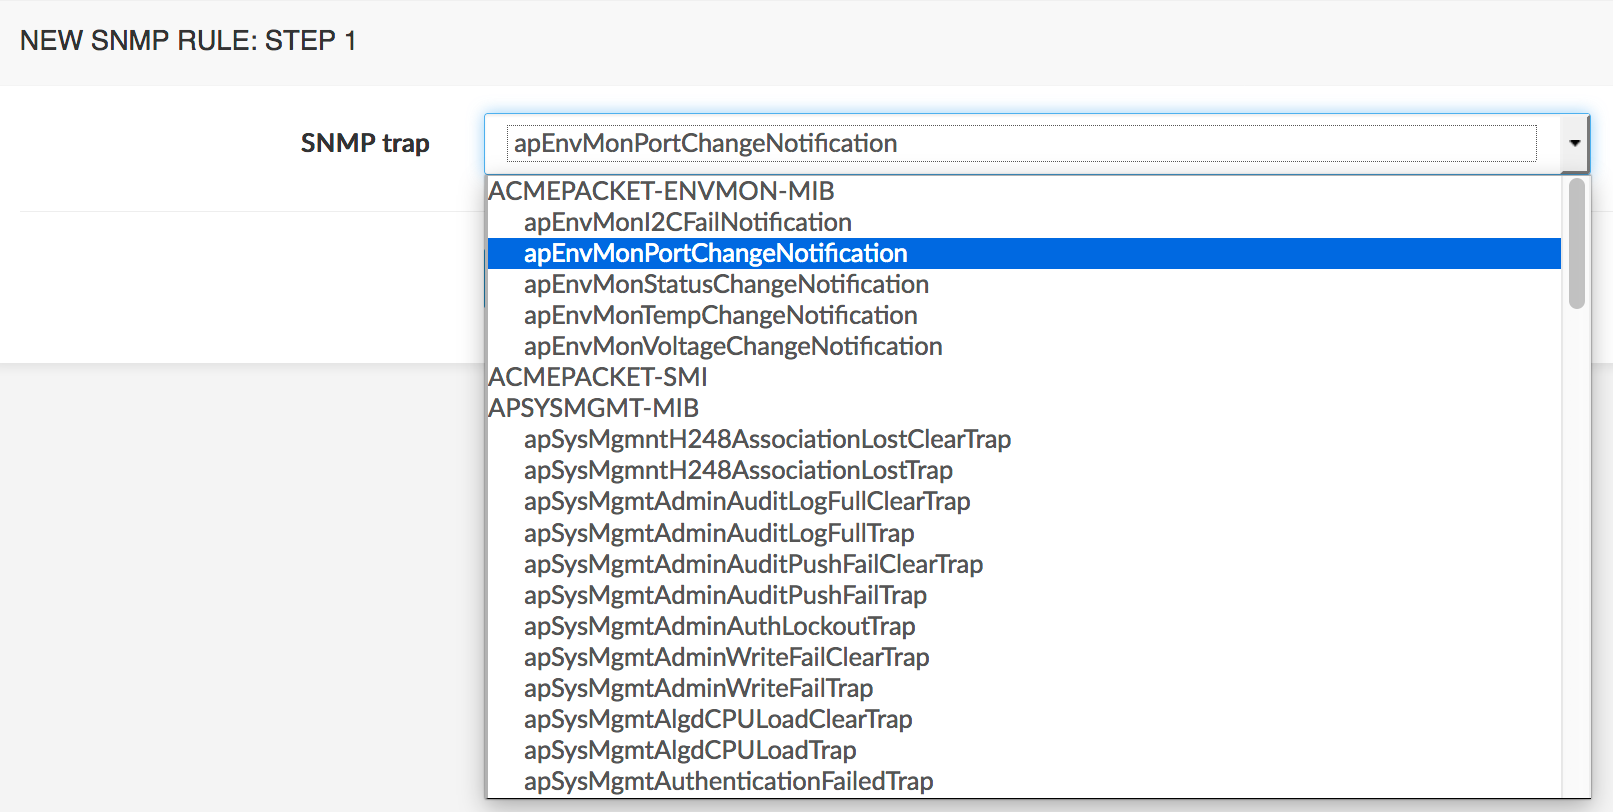
In the drop-down list, select from one of the available MIBs the SNMP trap you want alarms to be raised for, then click Next. This opens the New SNMP Rule: Step 2 window, illustrated below.
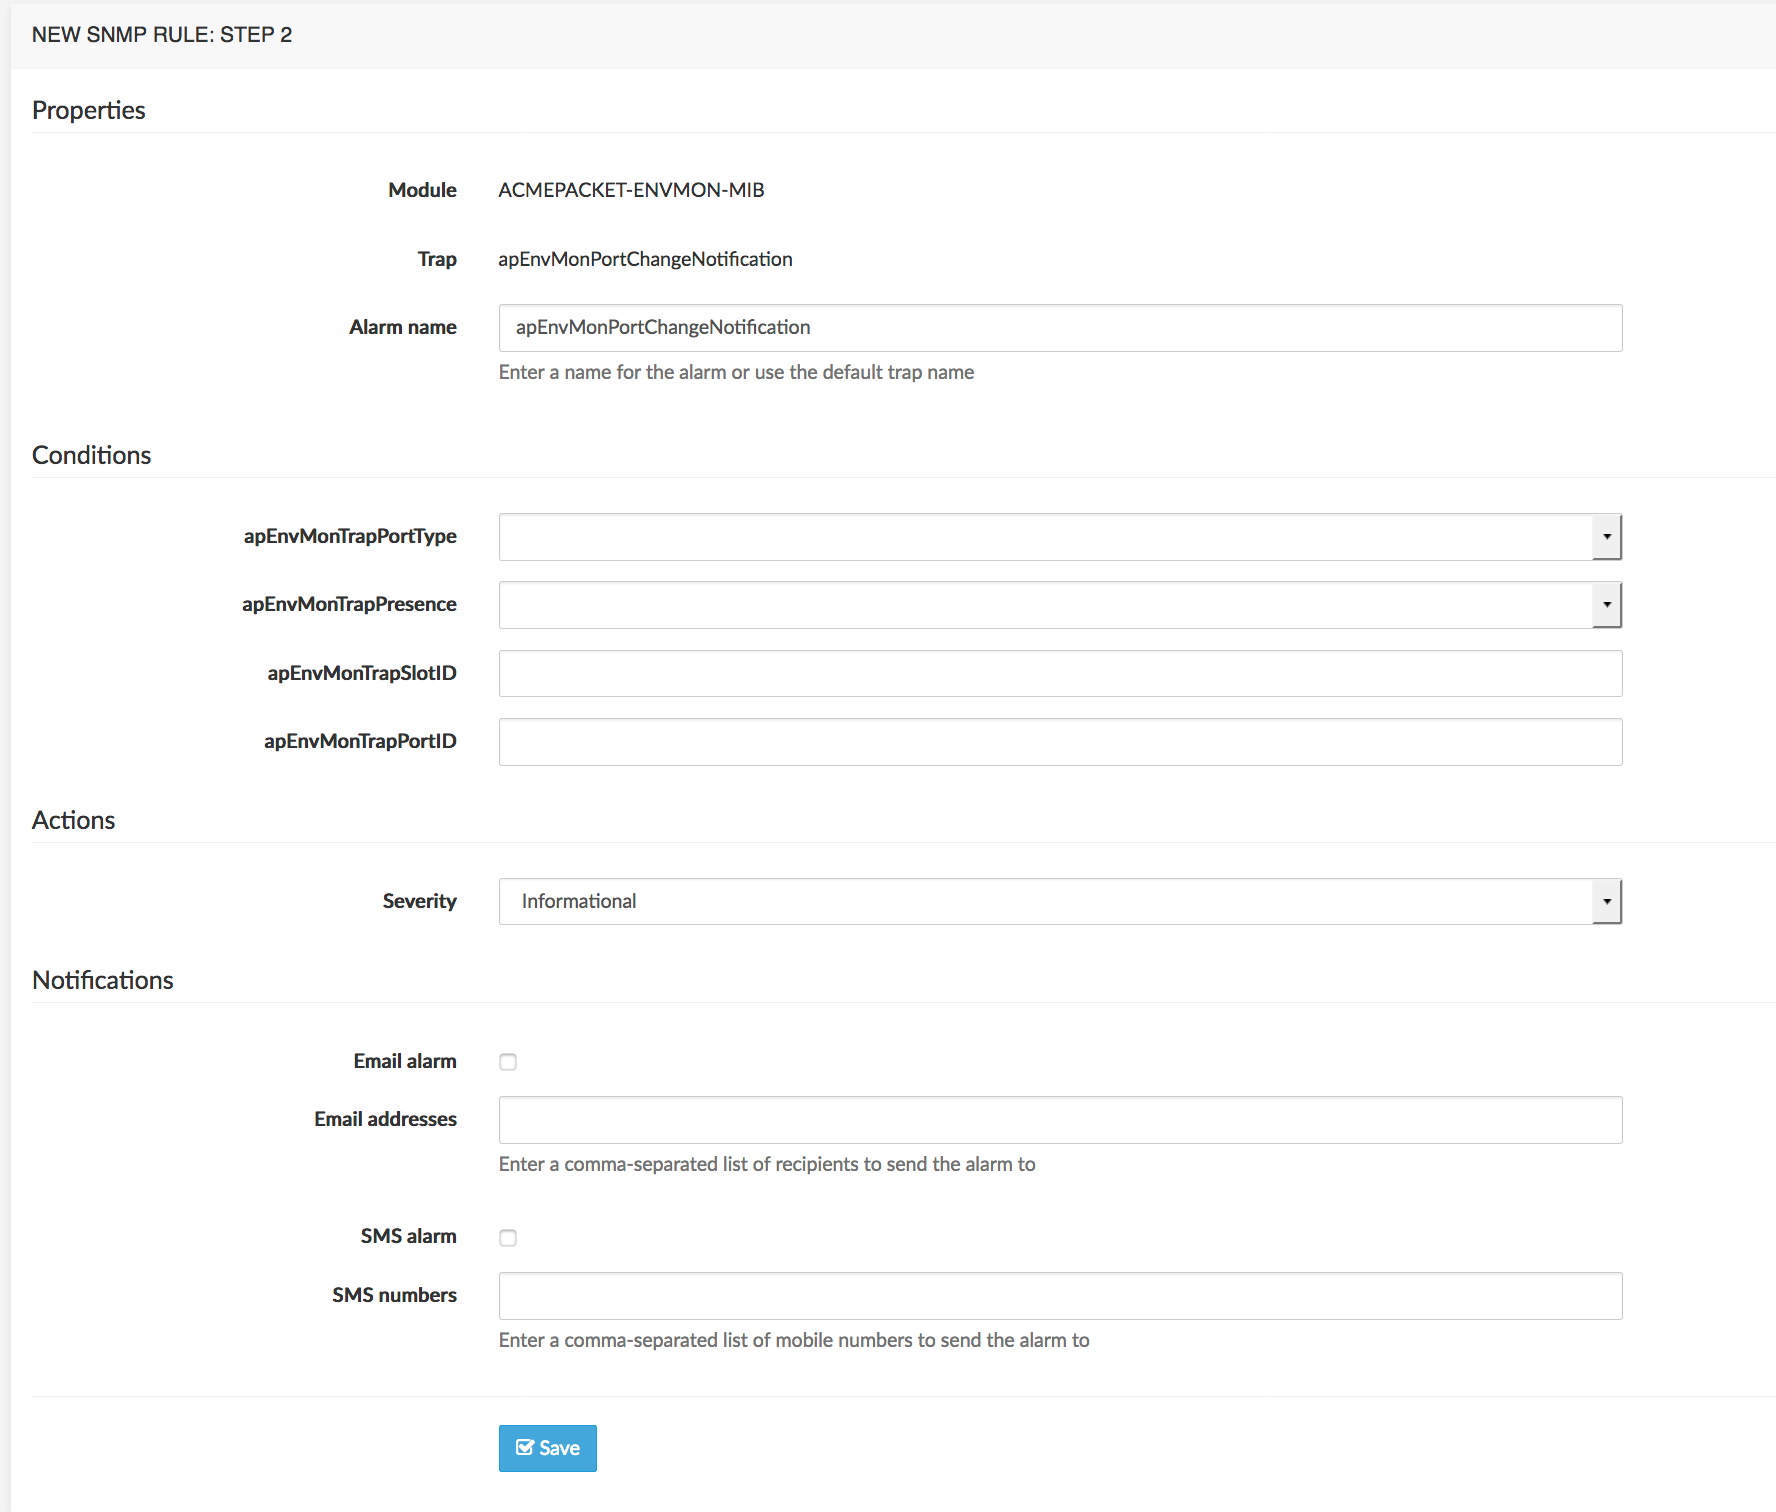
The Properties section mentions the SNMP trap originating MIB, the selected Trap name, and an Alarm name text field, showing the default name of the alarm. This field allows changing that default name into a more descriptive one, and to display the current value of any of the trap's variables listed in the Conditions section below.
For example, to change the default apEnvMonPortChangeNotification name into "Port change notification for:" and have an alarm that shows the value of variable apEnvMonTrapPortID, change the Alarm name field like this:
Port Change Notification for
with the variable enclosed in a container made of double curly braces: , as illustrated below.

The Conditions section displays the variables of the trap selected in Properties, with their possible values in drop-down lists when applicable. You can select or provide the value(s) for which you want a conditional alarm to be raised ("raise an alarm if condition is true").
The Actions section allows selecting the severity level for the alarm: Informational, Warning, Minor, Major, Critical.
The Notifications section allows setting the values needed for e-mail and SMS notifications. The two check-boxes activate the corresponding notification mode.
Click Save when done to come back to the SNMP Rules Set browser window, where the new rule is now listed.
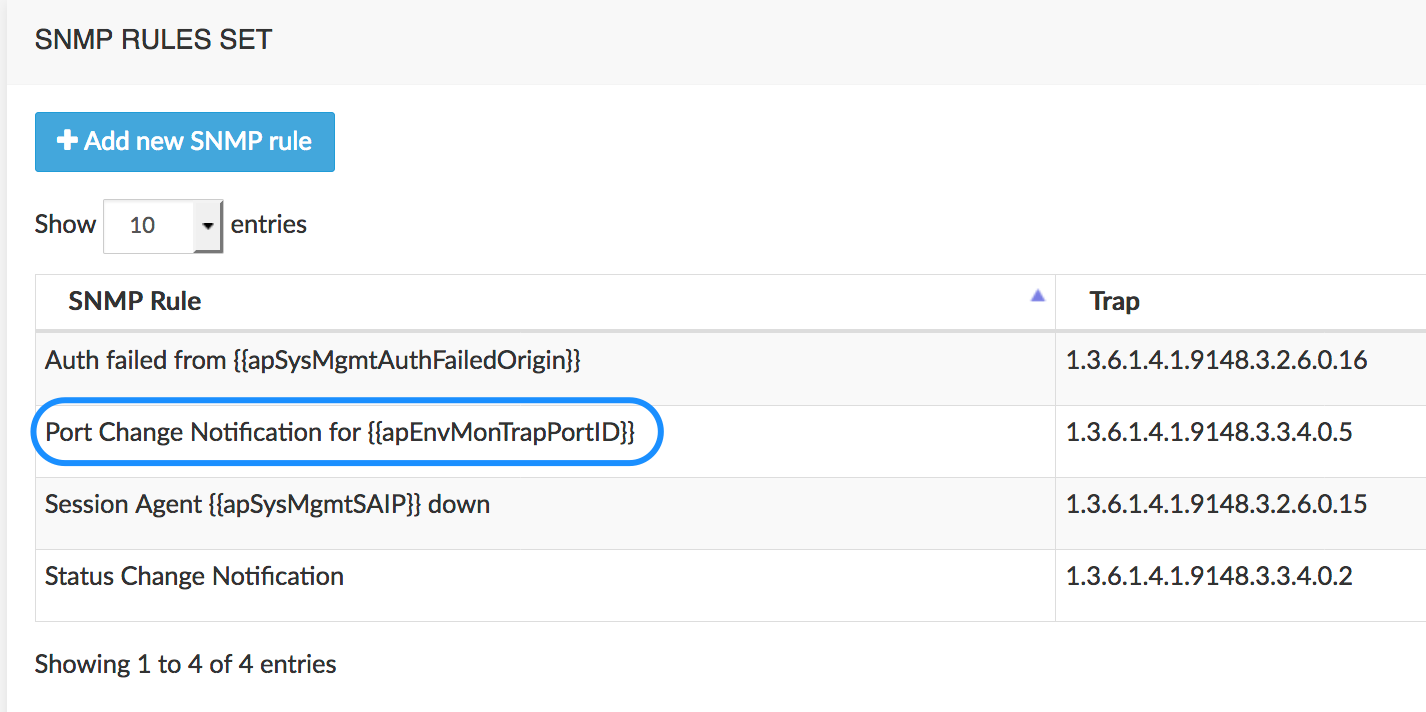
From then on, when the SNMP system sends the apEnvMonPortChangeNotification trap, the alarm with the name "Port Change Notification for" followed by the value of apEnvMonTrapPortID will appear in the Anomalies > SNMP Alarms browser window. This is illustrated below with a different alarm. See [SNMP Alarms] for more details about the SNMP Alarms browser window.

Tracing
When probes are installed in the network and the CaptureEngine and CaptureOrchestrator engines are running, the Tracing sub-menu allows you to define traces and to activate them.
Tracing being a heavy resources consuming process, especially when the capture of RTP streams is desired, it is advisable to define traces to limit the RTP capture to selected called or called numbers, while tracing RTP stats can be activated for all numbers.
The Add Trace tool, illustrated below, allows defining a trace with the following criteria:
Description: a user-friendly name
Calling and Called: patterns to limit the tracing to the matching number(s)
WARNING
If these fields are left empty, all numbers will be traced.
Source IP(s) and Destination IP(s): pattern to limit the tracing to the matching IP(s). CIDR ranges can be used.
Methods: allows selecting one SIP method as filter for tracing.
RTP Stats: when checked, will trace the RTP stats for the numbers defined in Calling / Called above
RTP Capture: when checked, will trace the RTP streams for the numbers defined in Calling / Called above
Trace Reason: drop-down list to document the reason for tracing personal data (GDPR)
Reason details: free text field for detailing the reason selected above.
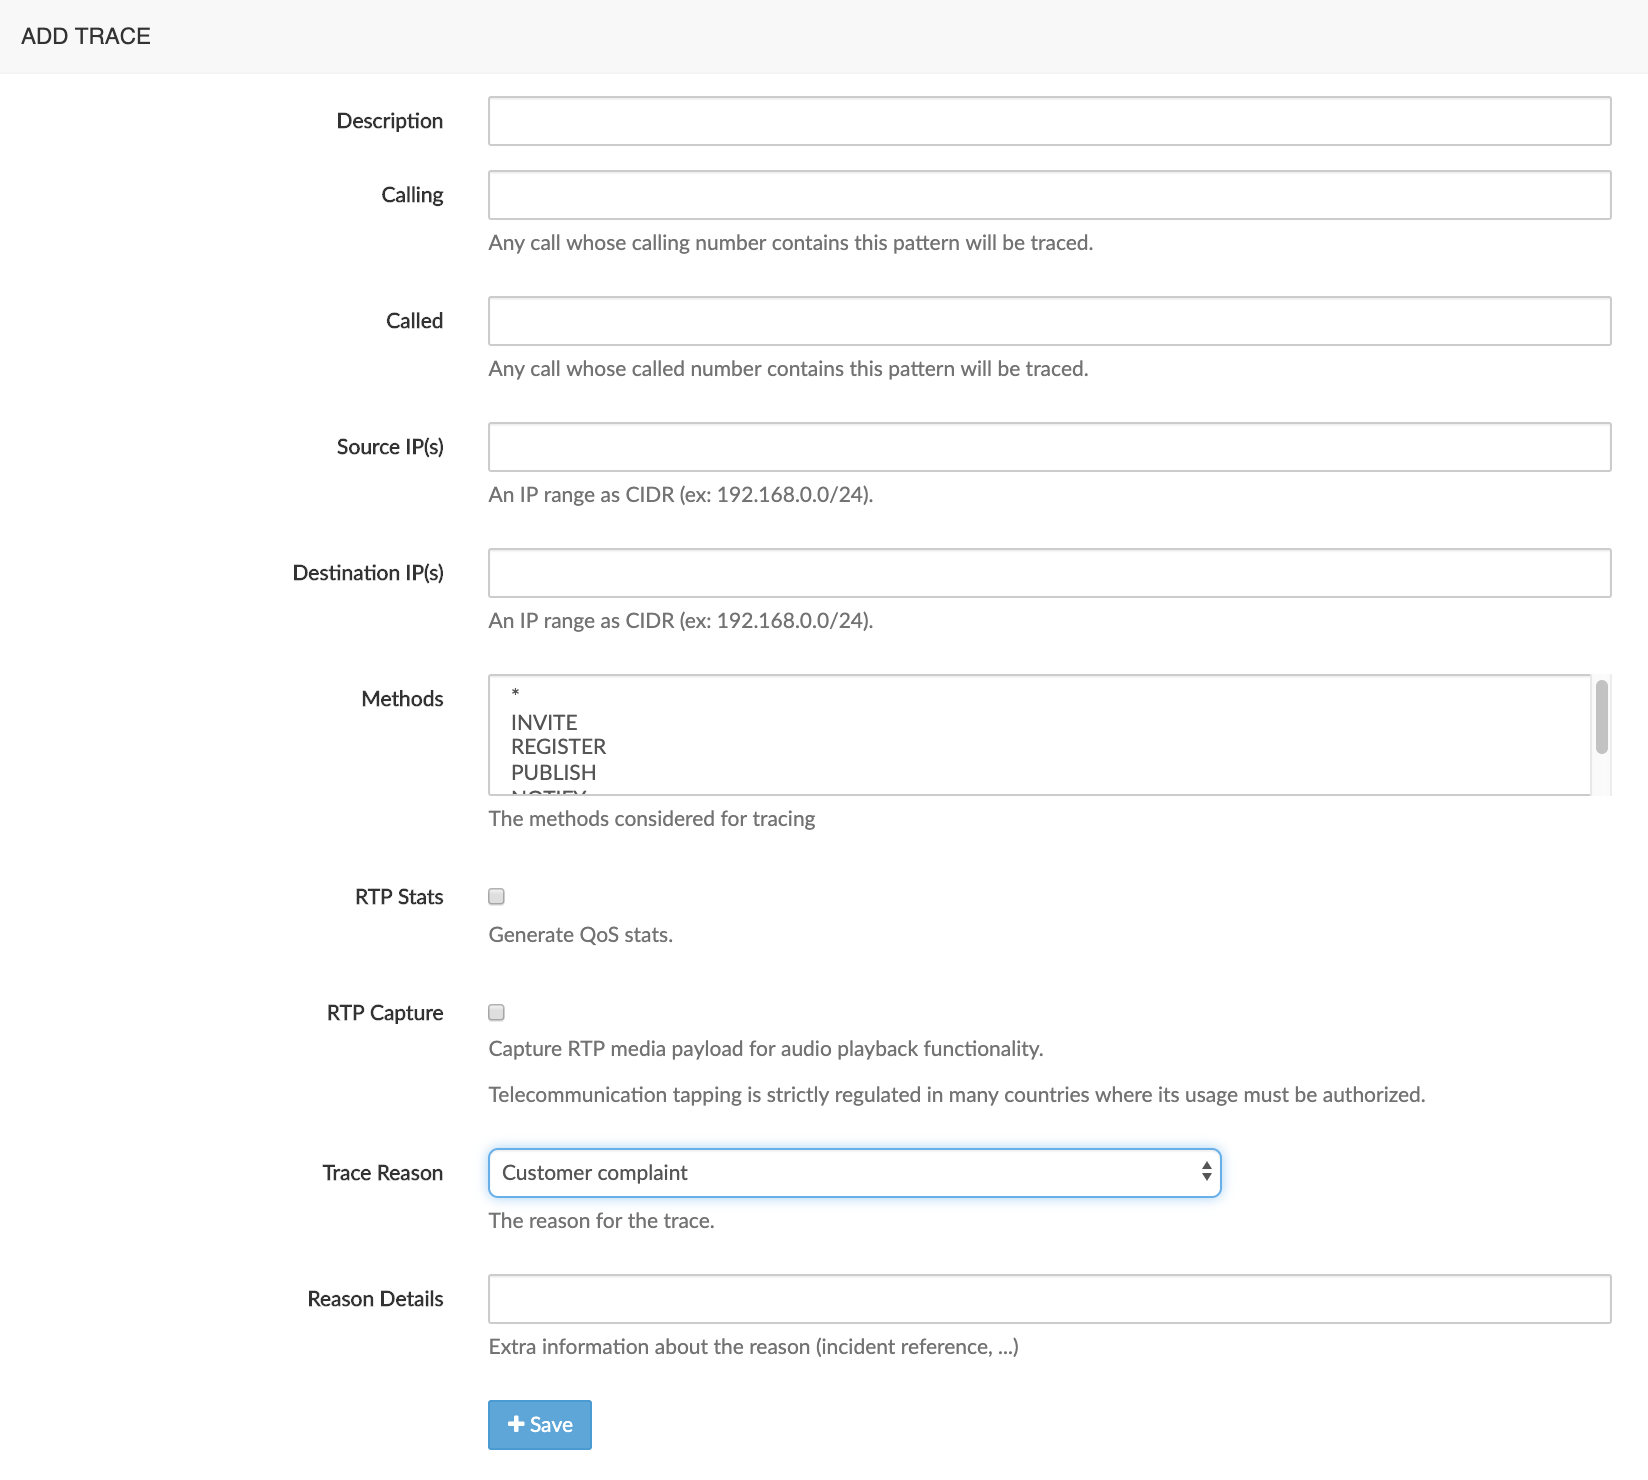
Click the Save button to save this trace and have it shown in the Active Traces browser.
The Active traces browser window, illustrated below, shows the traces currently active on the equipment.
INFO
This trace, added for demo purposes, would capture all RTP stats and all RTP flows for all calling or called numbers. This is not recommended.

To remove a trace (and permanently delete it from the system), click the Remove red button.
Metrics
Metrics allow computing specific statistics that are not provided in NEMO standard results.
As metrics are based on values from CDR fields, their creation and usage are targeted at administrators with an in-depth understanding of the underlying equipment's call data records.
The results computed by the metrics are shown in custom charts. The custom charts can be linked to the existing categories of result graphs (in Calls Statistics and Voice Quality menus). They are displayed together with the other graphs or in the Dashboard.
The custom metrics can also be included as elements in anomalies' definitions, which can in turn be used in configurable reports. Finally, they can be exported as elements of Statistics Reports.
The main Edit Metrics interface, illustrated below, lists the custom metrics currently provisioned on the system.

Create a Metric
To create a metric, click the + New metric button to open the Edit Metrics form, illustrated below. Use this form to provide metric parameters (explained below the picture).
WARNING
Any newly defined metric must be authorized in the user privileges to be used as a condition in Anomaly Definition (see below Active field and Anomalies Profile → Anomaly Definition above).
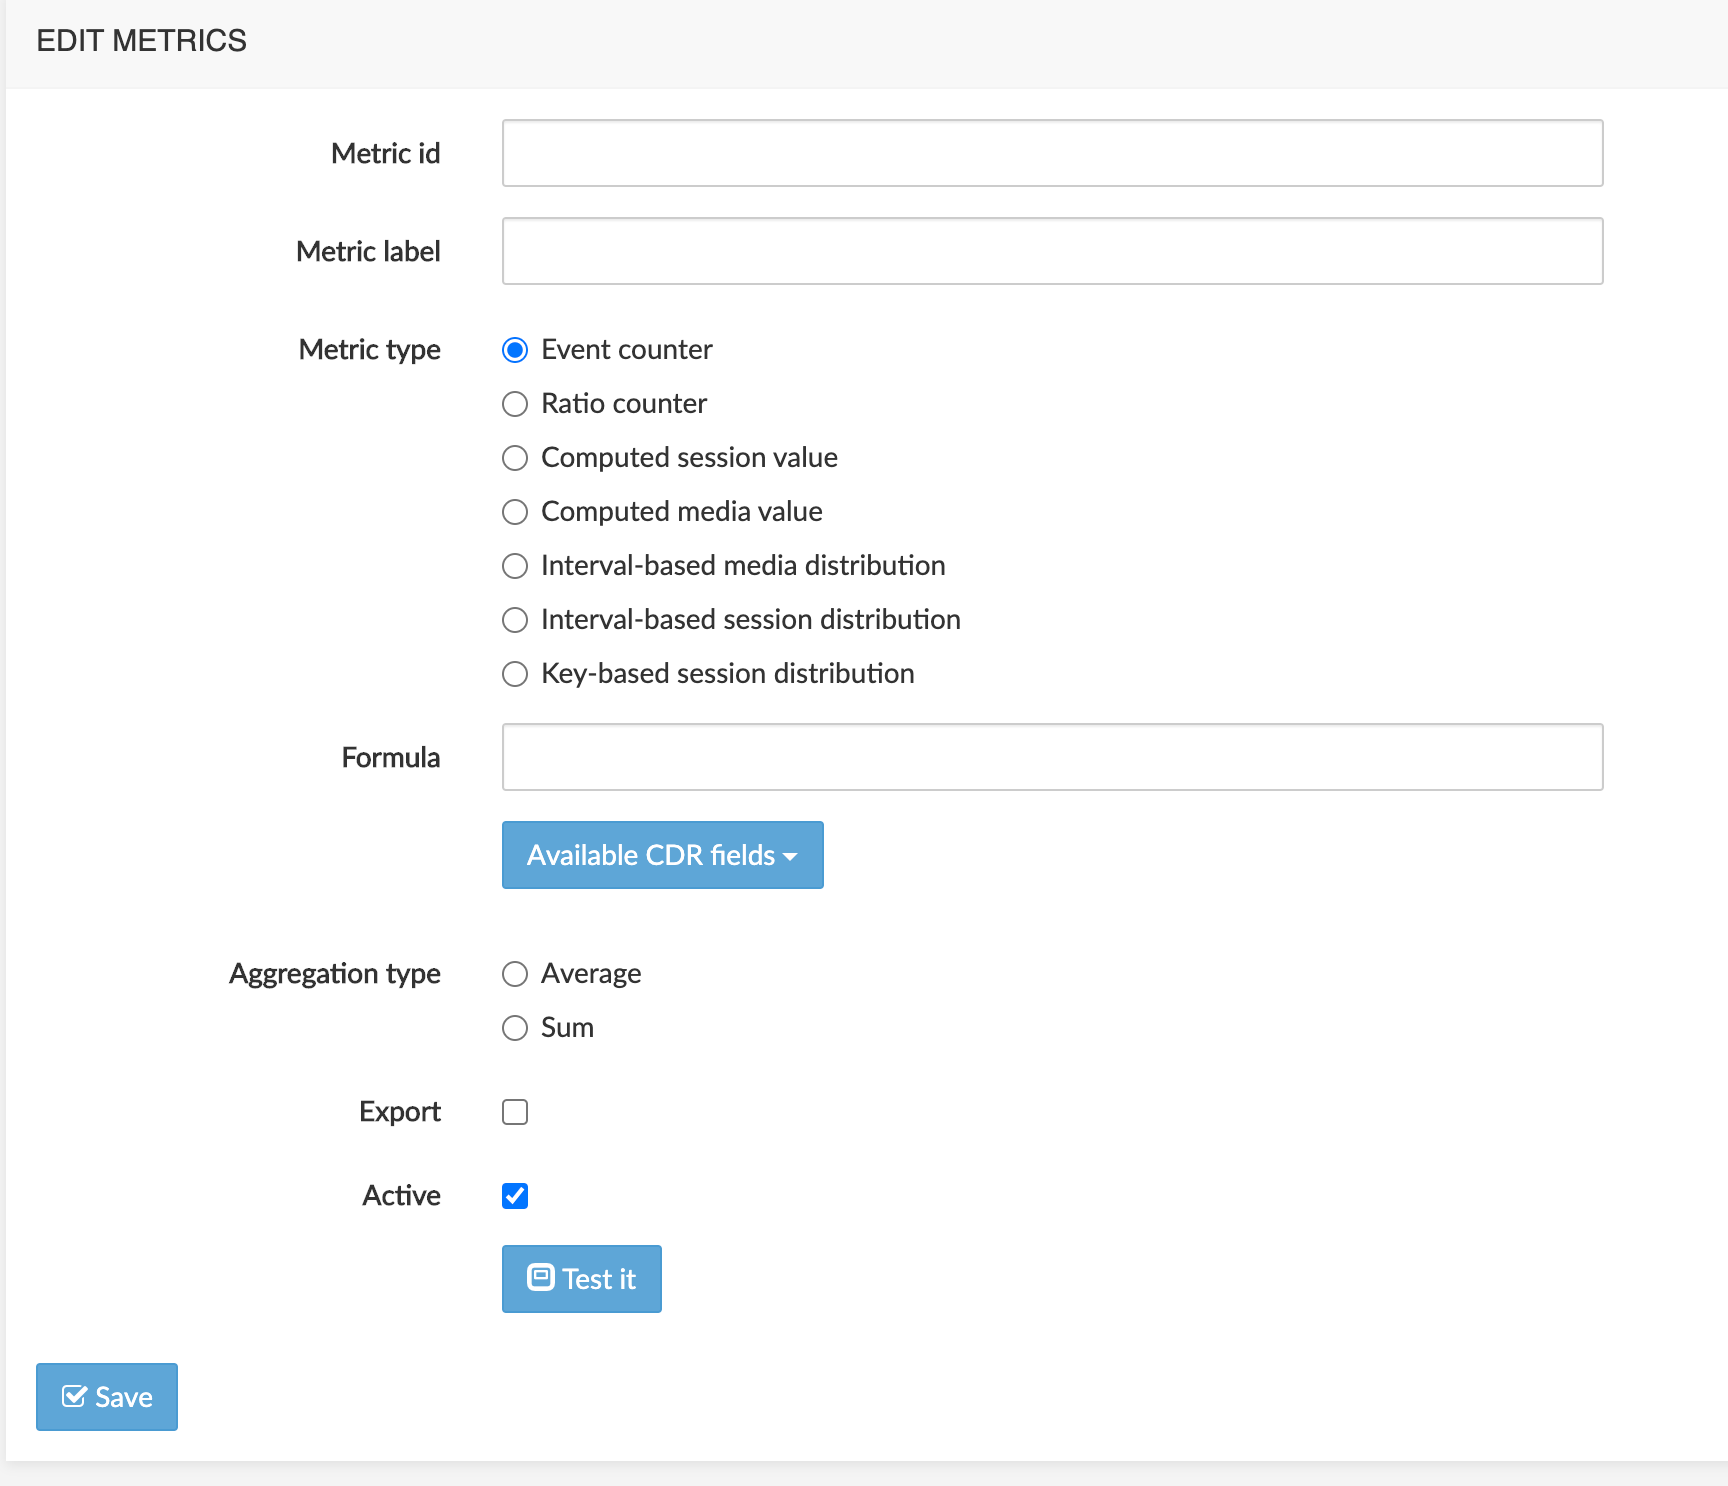
Fields
Metric id: unique id for the metric. Lower case, digits and underscore (_) are the only authorized characters
Metric label: text string used in help tooltip, lists and reports
Metric type: 6 types are available.
Event Counter: count of events which occurred, based on CDR criteria
The output of the formula is True (the counter is incremented) or False (the counter is unchanged).
Example: Number of calls where the post dial delay is more than 5000 msecs:
POST_DIAL_DELAY > 5000Ratio counter: result of the division of 2 existing metrics
The base metric is divided by the divisor.
Example: metric counting calls with release cause 500 divided by total number of calls
Computed session value: derive a value from one or more fields from the CDR
The output of the formula is a numerical value.
Example: ringing duration:
CONNECT_TIME - SETUP_TIMEComputed media value: derive a value from one or more fields from the CDR
Distinct formulas can be defined for ingress & egress calls so that media statistics are aggregated by media direction and not by call direction.
The output of the formula are numerical values.
Example: packet loss:
ingress:
CALLING_RTCP_PACKETS_LOST_FS1 / CALLING_RTCP_PACKETS_LOST_FS1 + CALLING_PACKETS_FS1egress:
CALLED_RTCP_PACKETS_LOST_FS1 / CALLED_RTCP_PACKETS_LOST_FS1 + CALLED_PACKETS_FS1
Interval-based media distribution: like a computed media value, the output value is derived from one or more CDR fields
The output value is used to increment one of the intervals of the distribution
Example: packet latency, in intervals of 10 msecs
CALLING_RTCP_AVG_LATENCY_FS1 / 10, CALLED_RTCP_AVG_LATENCY_FS1 / 10Interval-based session distribution: like a computed session value, the output value is derived from one or more CDR field
The output value is used to increment one of the intervals of the distribution
Example: post-dial delay, in intervals of 100 msecs:
POST_DIAL_DELAY / 100Key-based session distribution: derive a value from one or more fields from the CDR
The output value is text and is used to classify calls in "bins".
Example: distinguish calls based on codec type:
FLOWTYPE_FS1_F
Formula
WARNING
The text string of the formula must be compliant with Python syntax. Some examples have been provided in Metric types above.
The formula is based on one or more CDR fields, to be copied from the drop-down list Available CDR fields. This list shows the CDR fields by name and value type (string, integer, float...).
The CDRs and their fields are equipment- and plugin-dependent (NEMO Capture or Net-NetSD).
Aggregation type: when the metric is used on more than one group (trunk), selects how the resulting value is computed: by average or sum.
Export: if checked, the metric is listed in the exportable statistics to be selected in Statistics export profile → Statistics tab.
Active: if checked, the metric is active, is computed from the moment it has been created, and appears:
in the selectable conditions list in Settings → Anomalies → Anomalies Profile → Anomalies → Anomaly definition
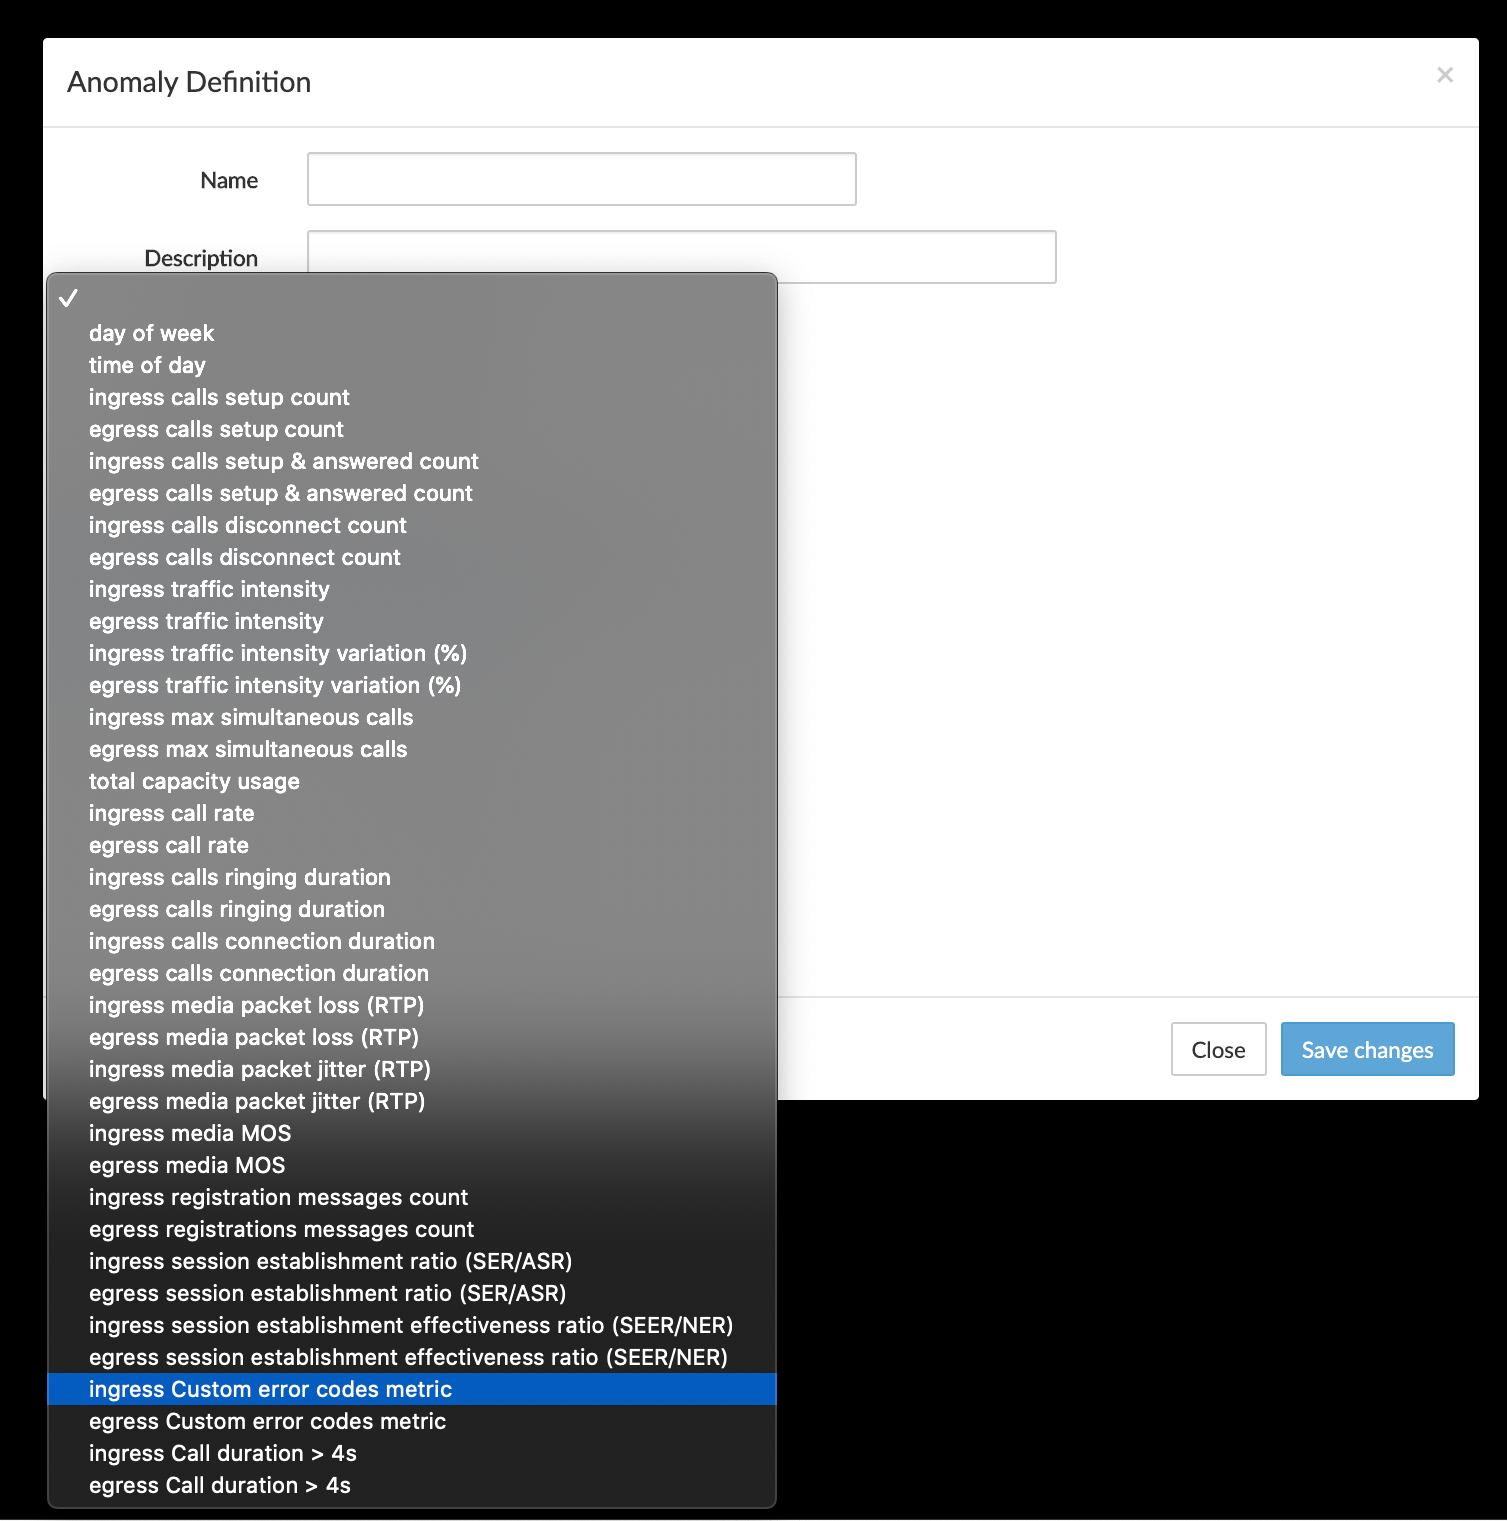
and in selectable metrics list in Settings → Metrics → Edit Metrics → Charts
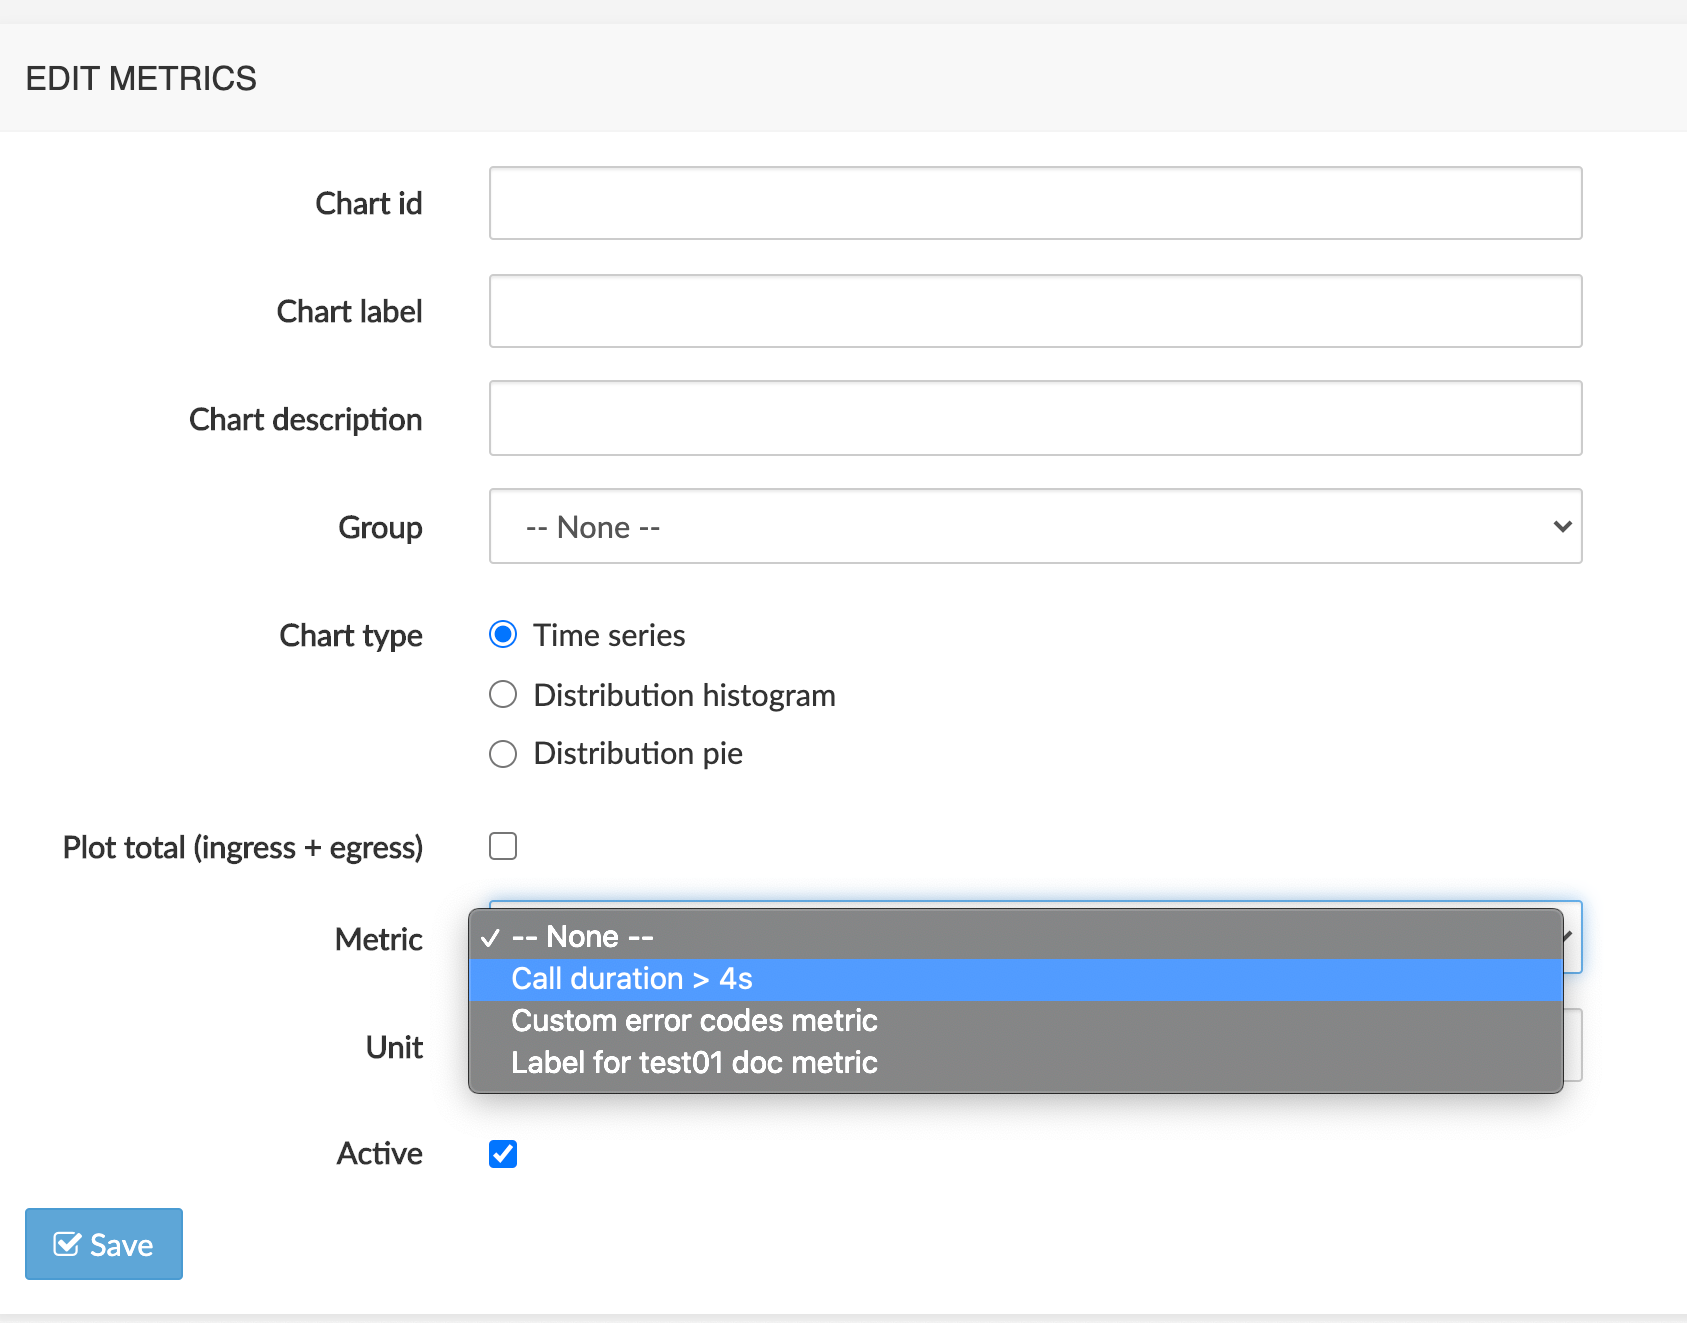
If unchecked (Inactive), the metric stops being computed and is not shown anymore in the selectable conditions list in Anomaly Definition. If a chart is linked to the metric, it is displayed but shows only results prior to the moment the metric's status becomes Inactive.
Click the Save button to save the new metric.
Create a Chart
To create a chart, click the + New chart button to open the Edit Metrics form, illustrated below. Use this form to provide chart parameters (explained below the picture).
WARNING
Any newly defined chart must be authorized in the user privileges to be visible (see Edit User → Active charts above).
For the chart to plot current values, the reference metric must be active.
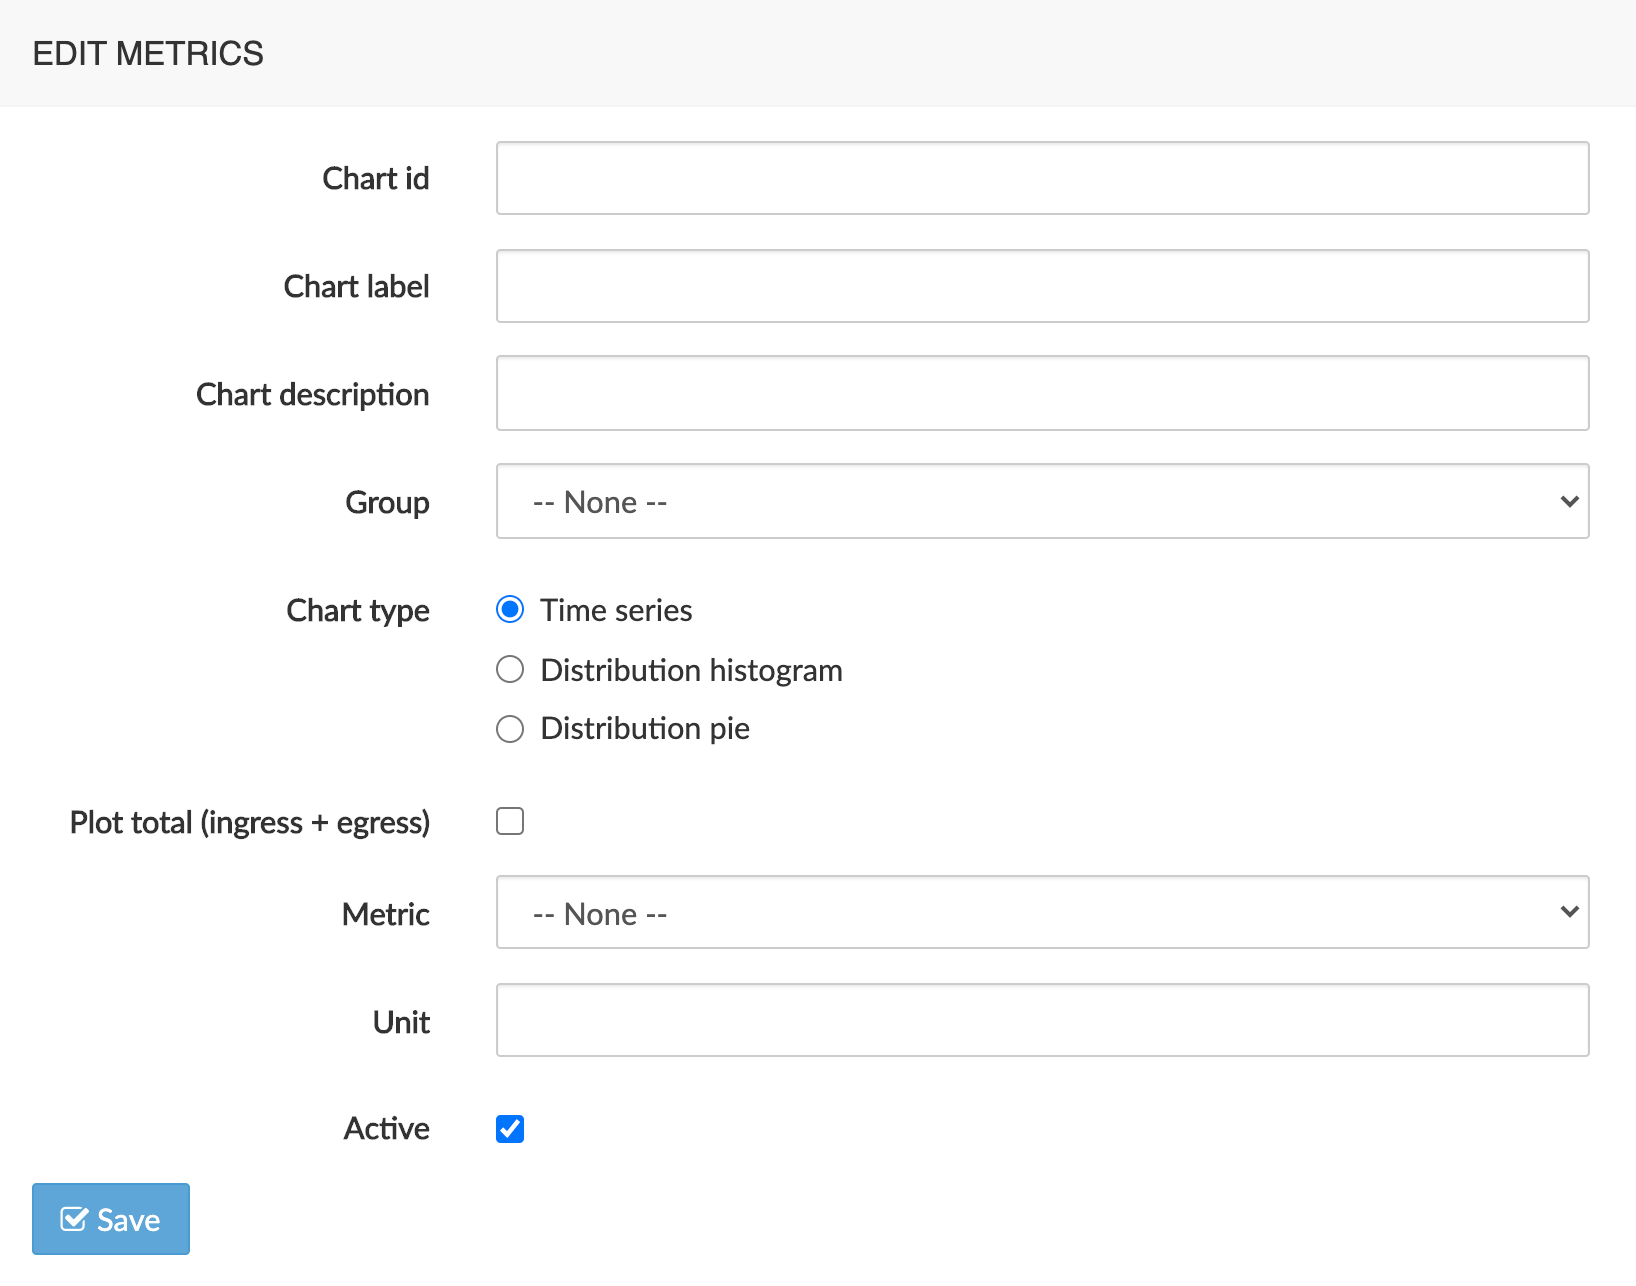
Fields
Chart id: unique id for the chart. Lower case, digits and underscore (_) are the only authorized characters
Chart label: text string used in lists and reports
Chart description: more verbose text string used in help tooltip
Group: one category of results in Call Statistics or Voice Quality this chart is associated with
Chart type:
Time Series: evolution of a metric over time: relies on events counter, ratio counter, computed session value or computed media value. X axis is time, Y axis is value
Distribution histogram: distribution of characteristics of calls. X axis is intervals, Y axis is proportion of occurrences of that specific interval value
Distribution pie: distribution of characteristics of calls, identified by labels: relies on key-based session distribution
Plot total (ingress + egress): if Plot total is active, the chart displays 3 lines: ingress, egress, total and the legend displays these 3 data series. If disabled, the chart displays 2 lines: ingress, egress and the legend displays these 2 data series.
Metric: a reference metric providing the values to plot
Unit: the unit of the values, to be used as unit label in the legend of the plotted chart
Active: if checked, the chart is active and appears in the selectable statistics list for the Dashboard charts.
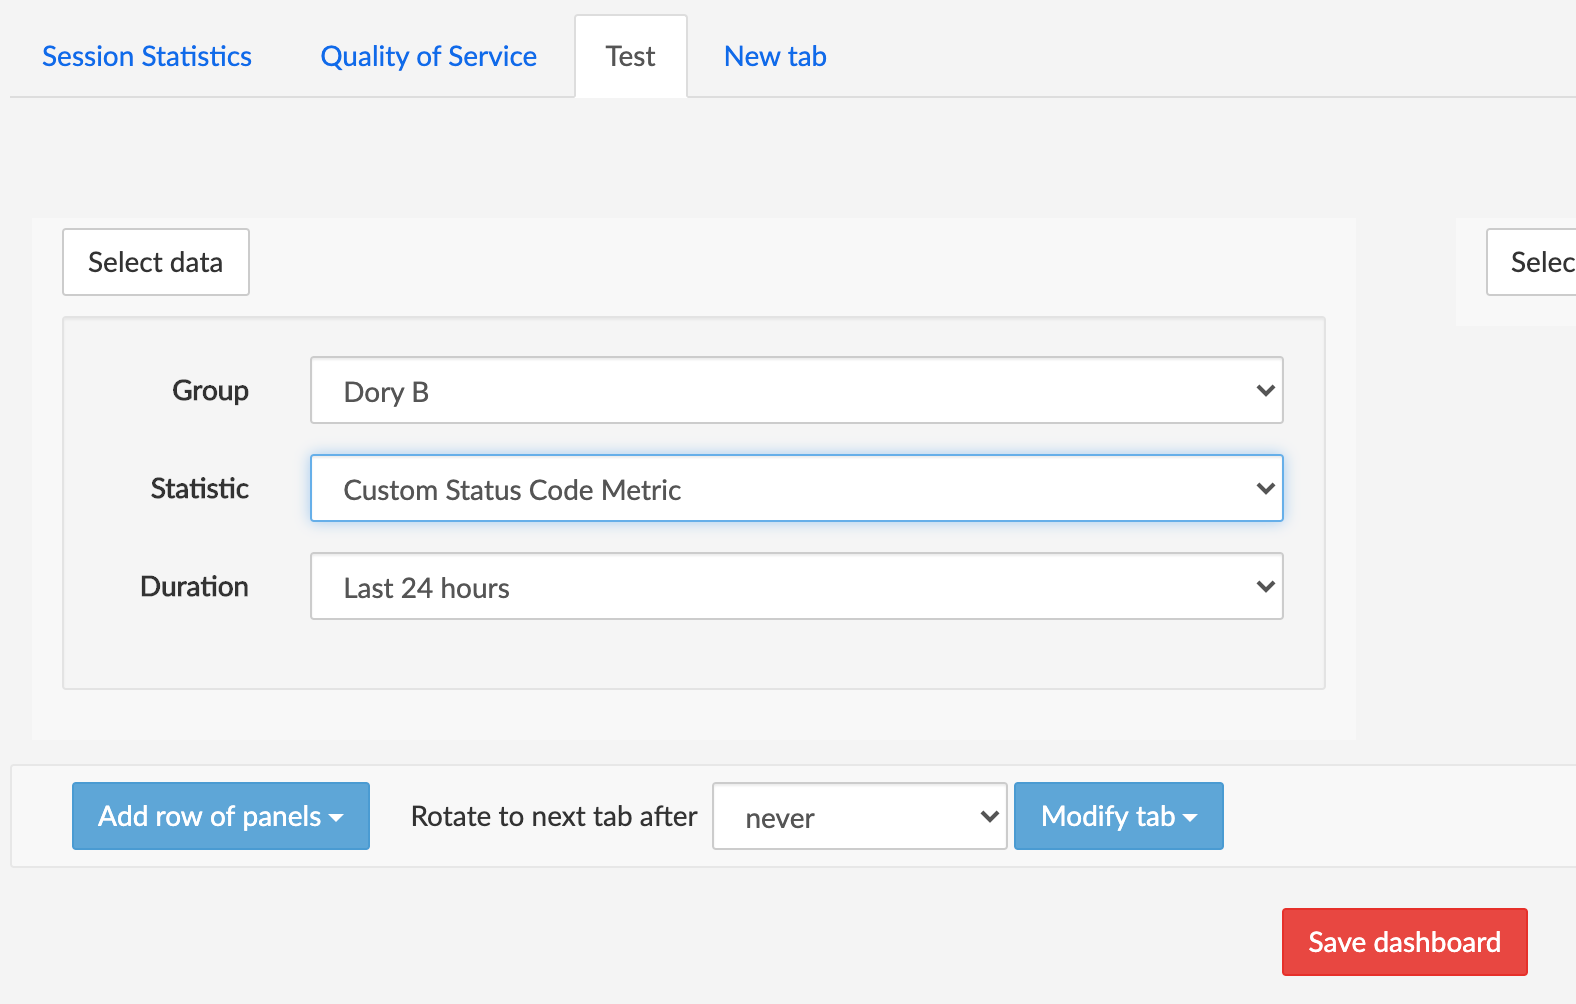
If unchecked (Inactive), the chart is not shown anymore in the selectable statistics list for the Dashboard charts and disappears from the category in Call Statistics and Voice Quality results it has been associated with when created.
WARNING
Any newly defined chart must be authorized in the user privileges to be visible (see Edit User → Active charts above).
Edit an Existing Metric
To edit an existing metric, click the Edit blue button in the Edit column of the Metric tab in the main Edit Metrics window (see [Edit Metrics List] above).
Changes to an existing metric exclude changing the metric id and the metric type. Other settings (Description, Formula, Aggregation type, Export and Active) can be modified.
Changes must be saved using the Save button (action often forgotten after testing).
Edit an Existing Chart
To edit an existing chart, click the Edit blue button in the Edit column of the Chart tab in the main Edit Metrics window (see [Edit Metrics List] above).
Changes to an existing chart exclude changing the chart id and the chart type. Other settings (Label, Description, Group, Plot total, Metric, Unit, Active) can be modified.
Changes must be saved using the Save button.
Remove a Metric or Chart
To remove an existing metric or chart from the system, click Remove red button in the Remove column of the Metric or Chart tab in the Edit Metrics window (see [Edit Metrics List] above).
System
The System sub-menu allows you to configure the core applications part of the NEMO platform.
WARNING
Only the system administrator or Netaxis support team should perform such configuration changes, as they might impact the whole processing chain.
Configure the GUI
Use the menu illustrated below to set various global parameters for the Web GUI:
maximum number of calls returned by the calls search tool: specifies the maximum number of calls returned in the calls search results table. Default: 10000. Larger values increase load on the system and can impact browser performance.
list of ranges to use for traffic intensity distribution pie: ranges to use for total capacity usage in format
label1,limit1;label2,limit2;…Example: usage 0%-80% of total capacity,0.8;usage 80%-95% of total capacity,0.95;usage 95%-100% of total capacity.
1.0 will create 3 ranges from 0 to 80% of total capacity, from 80% to 95% of total capacity and from 95% to 100% of total capacity.
list of ranges to use for MOS simplified pie chart: ranges to use for MOS overview chart in format
label1,limit1;label2,limit2;…Example: bad,2.0;medium,3.0;good,4.25;very good.
5.0 will create the 4 ranges "bad" from 0.0 to 2.0, "medium" from 2.0 to 3.0, "good" from 3.0 to 4.25 and "very good" from 4.25 to 5.00.
correlated sessions search window: window of time (in seconds) for searching correlating sessions. For a call from 10:32:15 to 10:33:45, NEMO will look for other sessions with the methods defined in the parameter below between 10:32:15 - 300 secs and 10:33:45 + 300 secs.
Example : 300
correlated sessions search SIP methods: defines additional SIP methods used to correlate call legs.
Example: REGISTER,SUBSCRIBE,NOTIFY
hostname mapping: defines the mapping between the names of the probes and their URL. Needed to reach the probes to download traces from them.
Example:
nemo3-demo-probe-lab-vmware3,http://10.0.10.18:8081/;nemo3-router-b,http://10.100.0.8:8081/;nemo3-router-a,http://10.100.0.7:8081/;nemo3-bridge-a,http://10.100.0.14:8081/;nemo3-bridge-b,http://10.100.0.15:8081/;dory-nemo3-probe-demo,http://10.100.0.13:8081/
csv file with hosts mapping: location of a csv file having mappings to replace hosts' IP addresses with user-friendly names, with mandatory header
IP-address,hostnameas shown below. IPv6 format is supported.Example: /opt/nemo/etc/hosts_mappings.csv

max log file size in bytes: maximum log file size, in bytes. Once this limit is reached, the log file is rotated and a new log file is created.
number of log files to keep: number of log files to keep, including the current one and the rotated ones.
log level: sets the logging severity level (2: data, 5: trace, 10: debug, 20: info, 30: warning, 40: error, 50: critical)
GUI syslog server: URL of a remote syslog server to send the GUI logs to
GUI syslog port: the port for this server
GUI syslog facility (auth, authpriv, cron, daemon, ftp, kern, lpr, mail, news, syslog, user, uucp, local0 to local7): the log category/ies to filter
AUDIT syslog server: URL of a remote syslog server to send the AUDIT logs to
AUDIT syslog port: the port for this server
AUDIT syslog facility (auth, authpriv, cron, daemon, ftp, kern, lpr, mail, news, syslog, user, uucp, local0 to local7) the log category/ies to filter
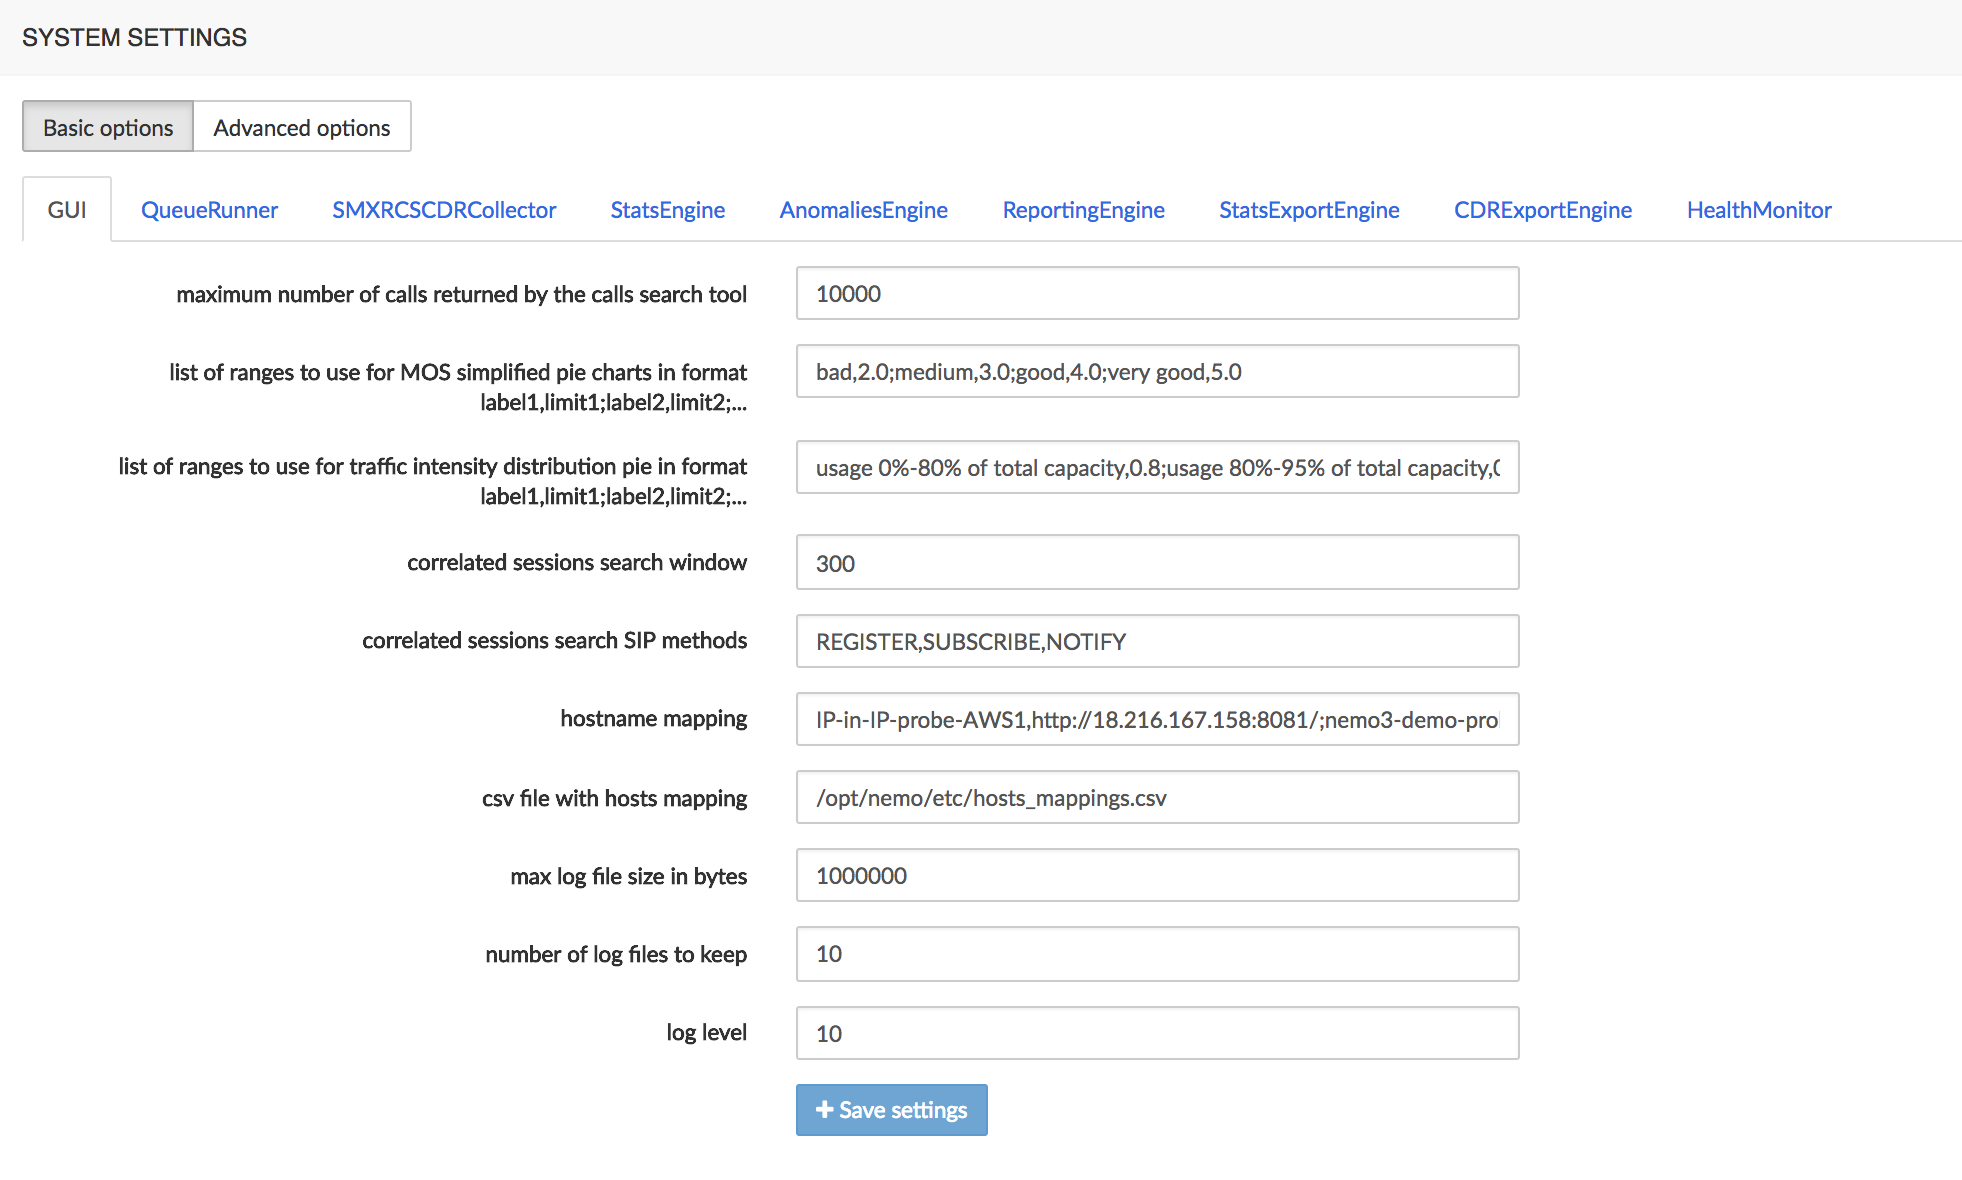
Configure the Queue Runners
The Queue Runners process the CDRs received at regular intervals from the SBC and insert them into the NEMO database. Use the menu illustrated below to set various parameters:
- max number of records processed per CDR queue file: a single queue runner can process from 10 to 1000 CDR files. A small value guarantees that the CDRs are processed in a chronological order but increases the load on the system. A large value improves performance but does not guarantee the chronological order of the CDRs processing.
- max number of records processed per run: absolute maximum of CDRs to process per run. A run consists in the queue runner examining all the queue files present once.
- auto-enable stats per realm for realms matching regular expression: regular expression that a newly detected realm system name must match to have the stats per realm automatically enabled. Example: R.*core$ will match any realm starting with an R and ending with core.
- auto-enable stats per IP for realms matching regular expression: regular expression that a newly detected realm system name must match to have the stats per IP automatically enabled. Example: peer[0-9]+$ will match any realm starting with peer, followed by at least one digit.
- max log file size in bytes: maximum log file size, in bytes. Once this limit is reached, the log file is rotated and a new log file is created
- number of log files to keep: number of log files to keep, including the current one and the rotated ones.
- log level: sets the logging severity level (2: data, 5: trace, 10: debug, 20: info, 30: warning, 40: error, 50: critical)
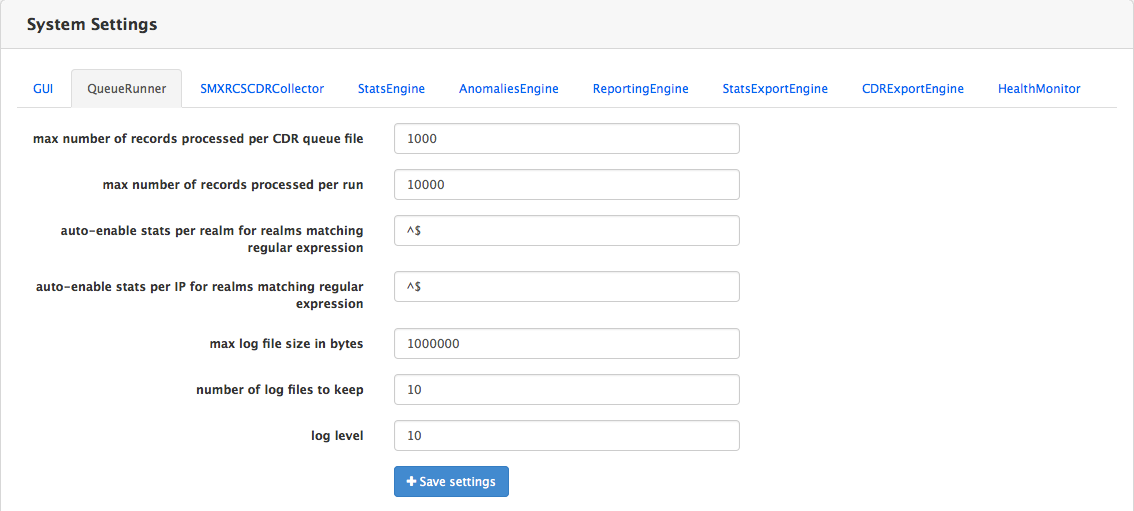
Configure the Collectors
This operation is strictly reserved to Netaxis support personnel.
WARNING
The picture below shows collectors that could be present in the system, depending on configuration and deployment. These collectors (red square) should NOT BE USED or MODIFIED by users or even system administrators.

Configure the Stats Engine
The Stats Engine processes the CDRs present in the database and computes consolidated metrics which are used to produce charts. Use the menu illustrated below to set various parameters:
- max log file size in bytes: maximum size, in bytes, for the log file. Once this limit is reached, the log file is rotated and a new log file is created.
- number of log files to keep: the number of log files to keep. This includes the current one and the rotated ones.
- log level: sets the logging severity level (2: data, 5: trace, 10: debug, 20: info, 30: warning, 40: error, 50: critical)
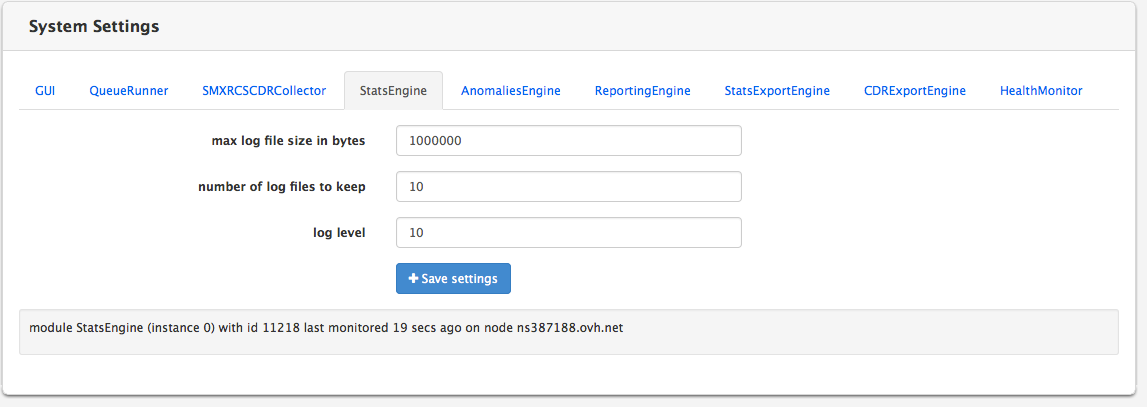
Configure the Anomalies Engine
The Anomalies Engine runs at regular intervals to process the statistics produced by the Stats Engine and run anomaly tests on them. Use the menu illustrated below to set various parameters:
- SMTP server: IP address of the SMTP server Nemo will send the traps to.
- SMTP port: destination port of the SMTP server
- SMTP SSL: flag to enable/disable to usage of SSL
- SMTP StartTLS: flag allowing to use this ancient specification to switch to encrypted mode
- SMTP username: Username for SMTP connection
- SMTP password: password for SMTP connection
- From email name: Name that will be displayed for the e-mail sent by Nemo.
- From email address: e-mail address for the e-mail sent by Nemo.
- HTTPS SMS URL: URL that will be used by Nemo to send the "HTTP GET" request to.
- max log file size in bytes: maximum size, in bytes, for the log file. Once this limit is reached, the log file is rotated and a new log file is created.
- number of log files to keep: the number of log files to keep. This includes the current one and the rotated ones.
- log level: sets the logging severity level (2: data, 5: trace, 10: debug, 20: info, 30: warning, 40: error, 50: critical)
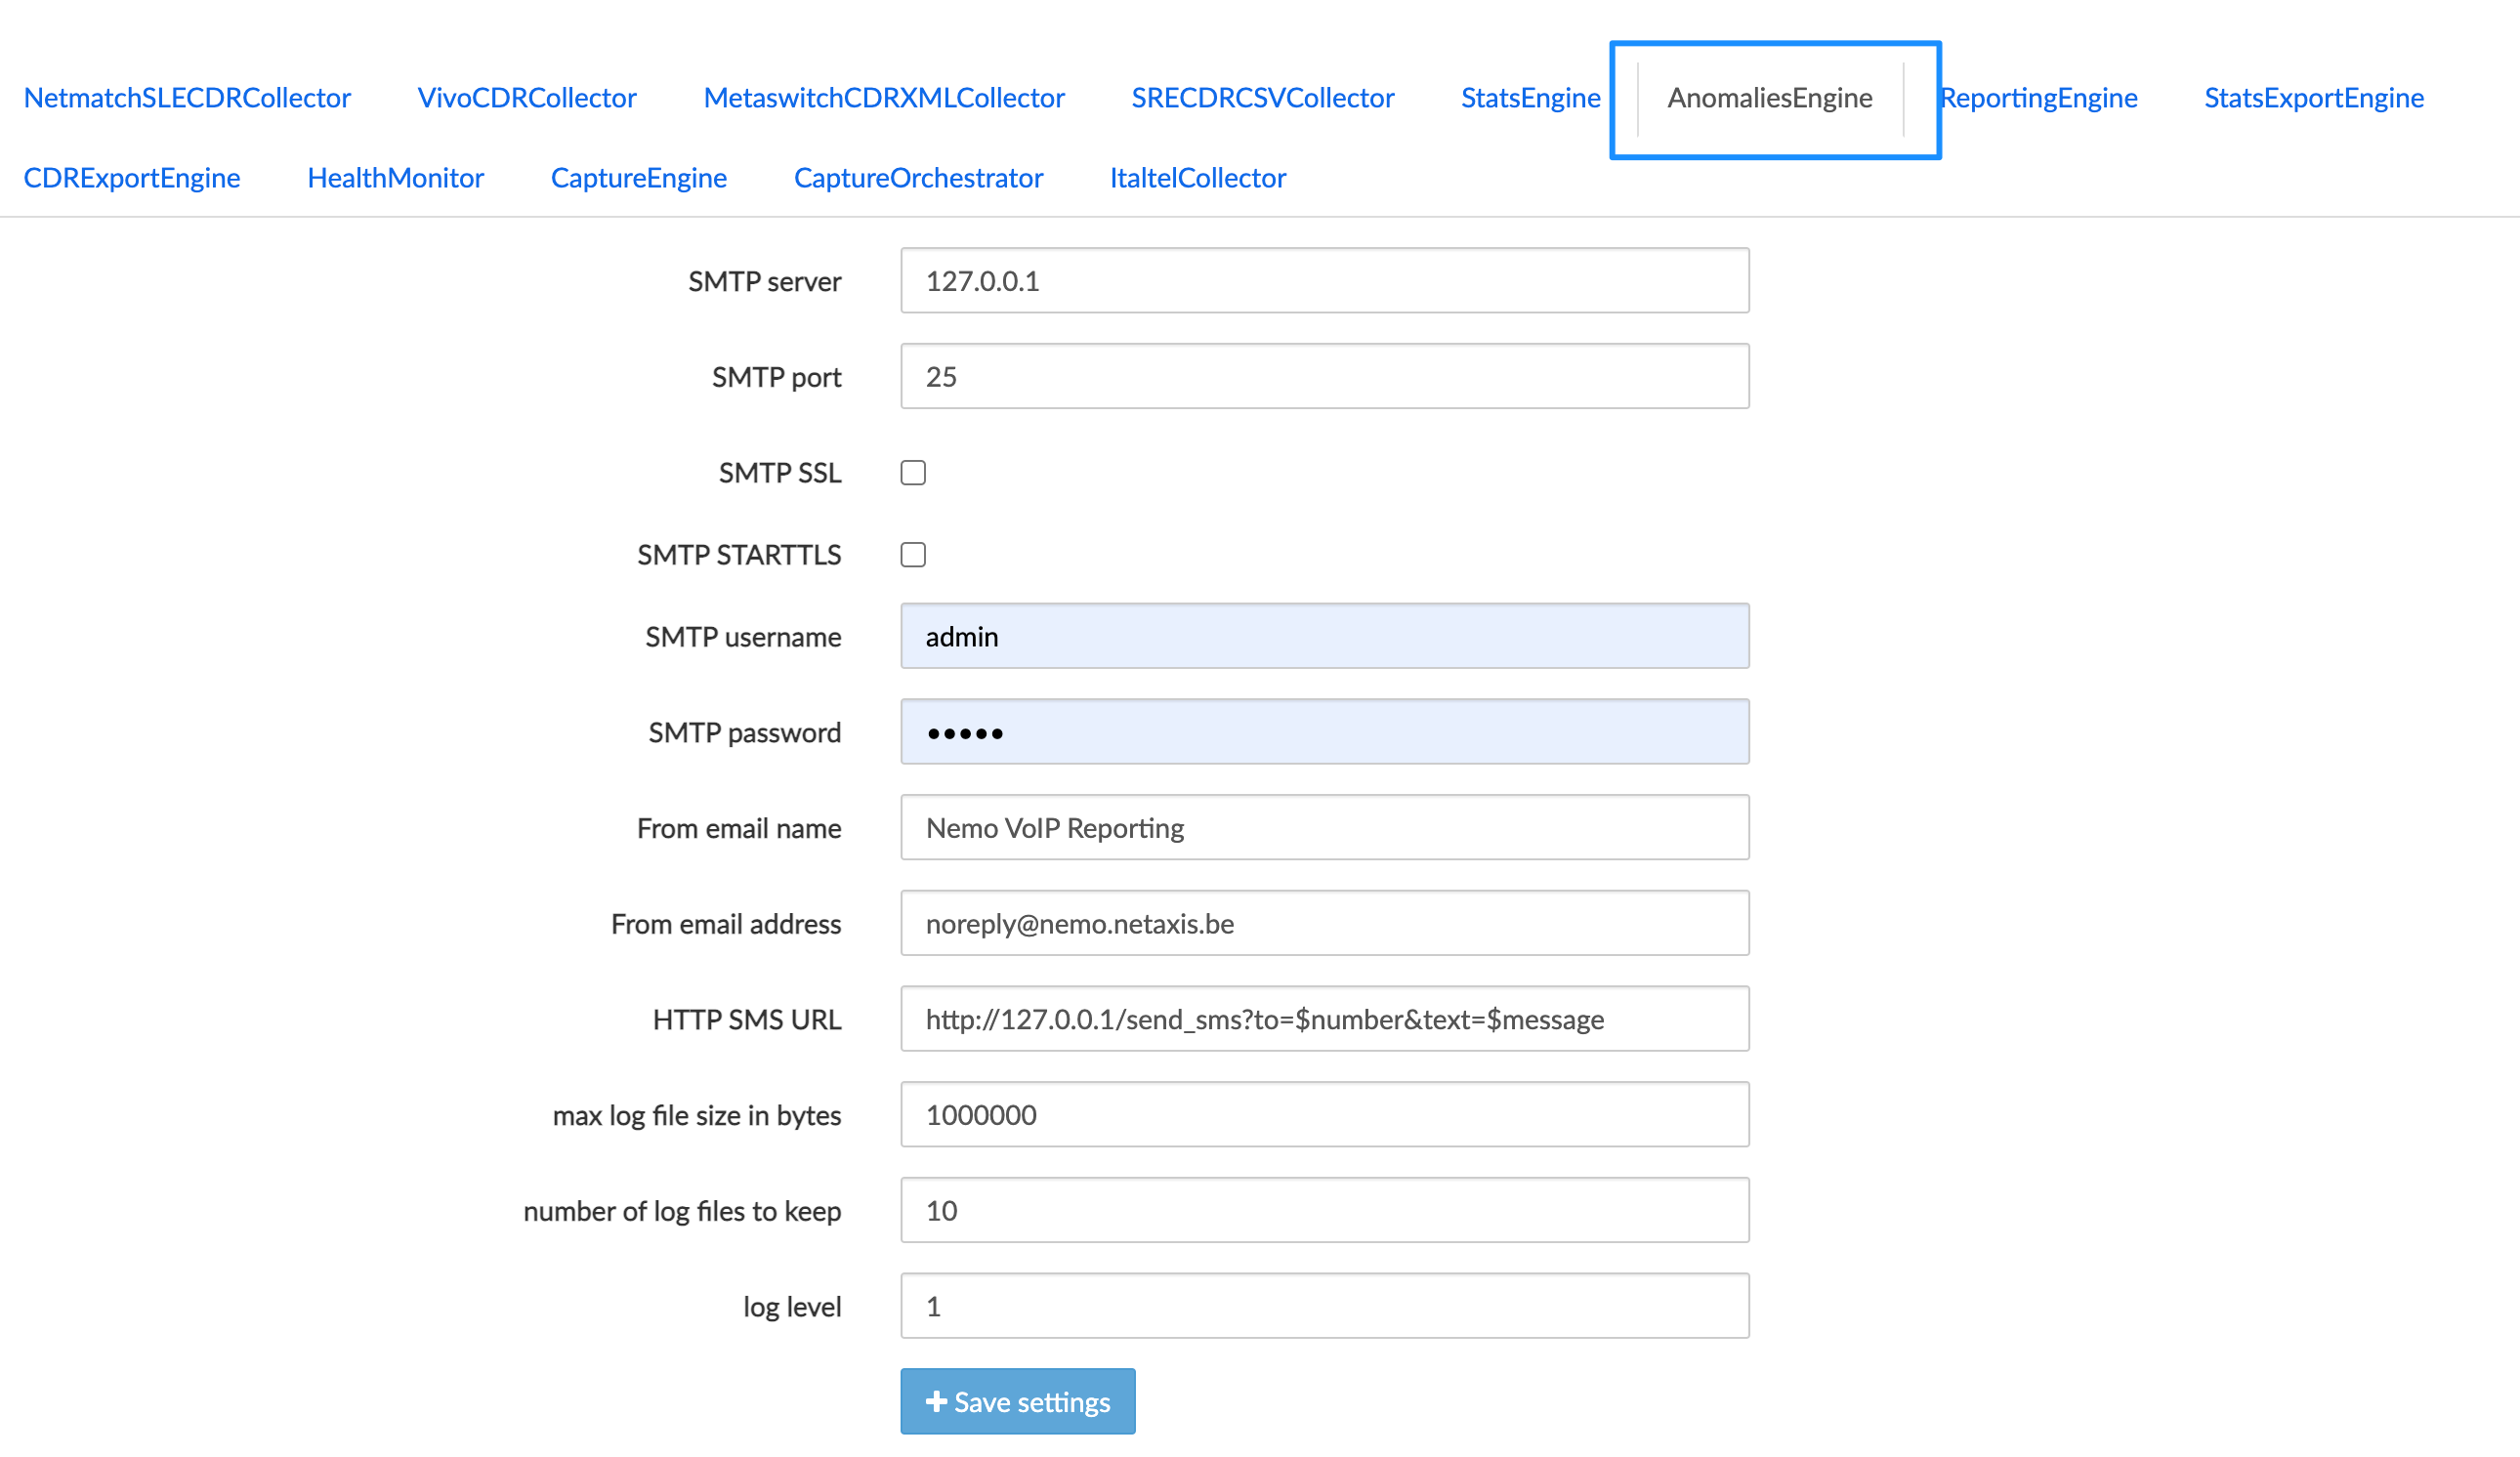
Configure the Reporting Engine
The Reporting Engine runs at regular intervals to produce reports based on the statistics computed by the Stats. Use the menu illustrated below to set various parameters:
- max points per chart: the maximum number of data points per chart. This setting affects the precision of time-based charts.
- path to logo file to include in reports: this the path (in Linux format) to a logo image file on the system to include in PDF reports. This image must be in PNG format.
- SMTP server: IP address of the SMTP server where Nemo will send the report to.
- SMTP port: destination port of the SMTP server
- SMTP SSL: flag to enable/disable to usage of SSL
- SMTP StartTLS: flag allowing to use this ancient specification to switch to encrypted mode
- SMTP username: username for SMTP connection
- SMTP password: password for SMTP connection
- From email name: Name that will be displayed for the e-mail sent by Nemo.
- From email address: e-mail address for the e-mail sent by Nemo.
- max log file size in bytes: maximum size, in bytes, for the log file. Once this limit is reached, the log file is rotated and a new log file is created.
- number of log files to keep: the number of log files to keep. This includes the current one and the rotated ones.
- log level: sets the logging severity level (2: data, 5: trace, 10: debug, 20: info, 30: warning, 40: error, 50: critical)
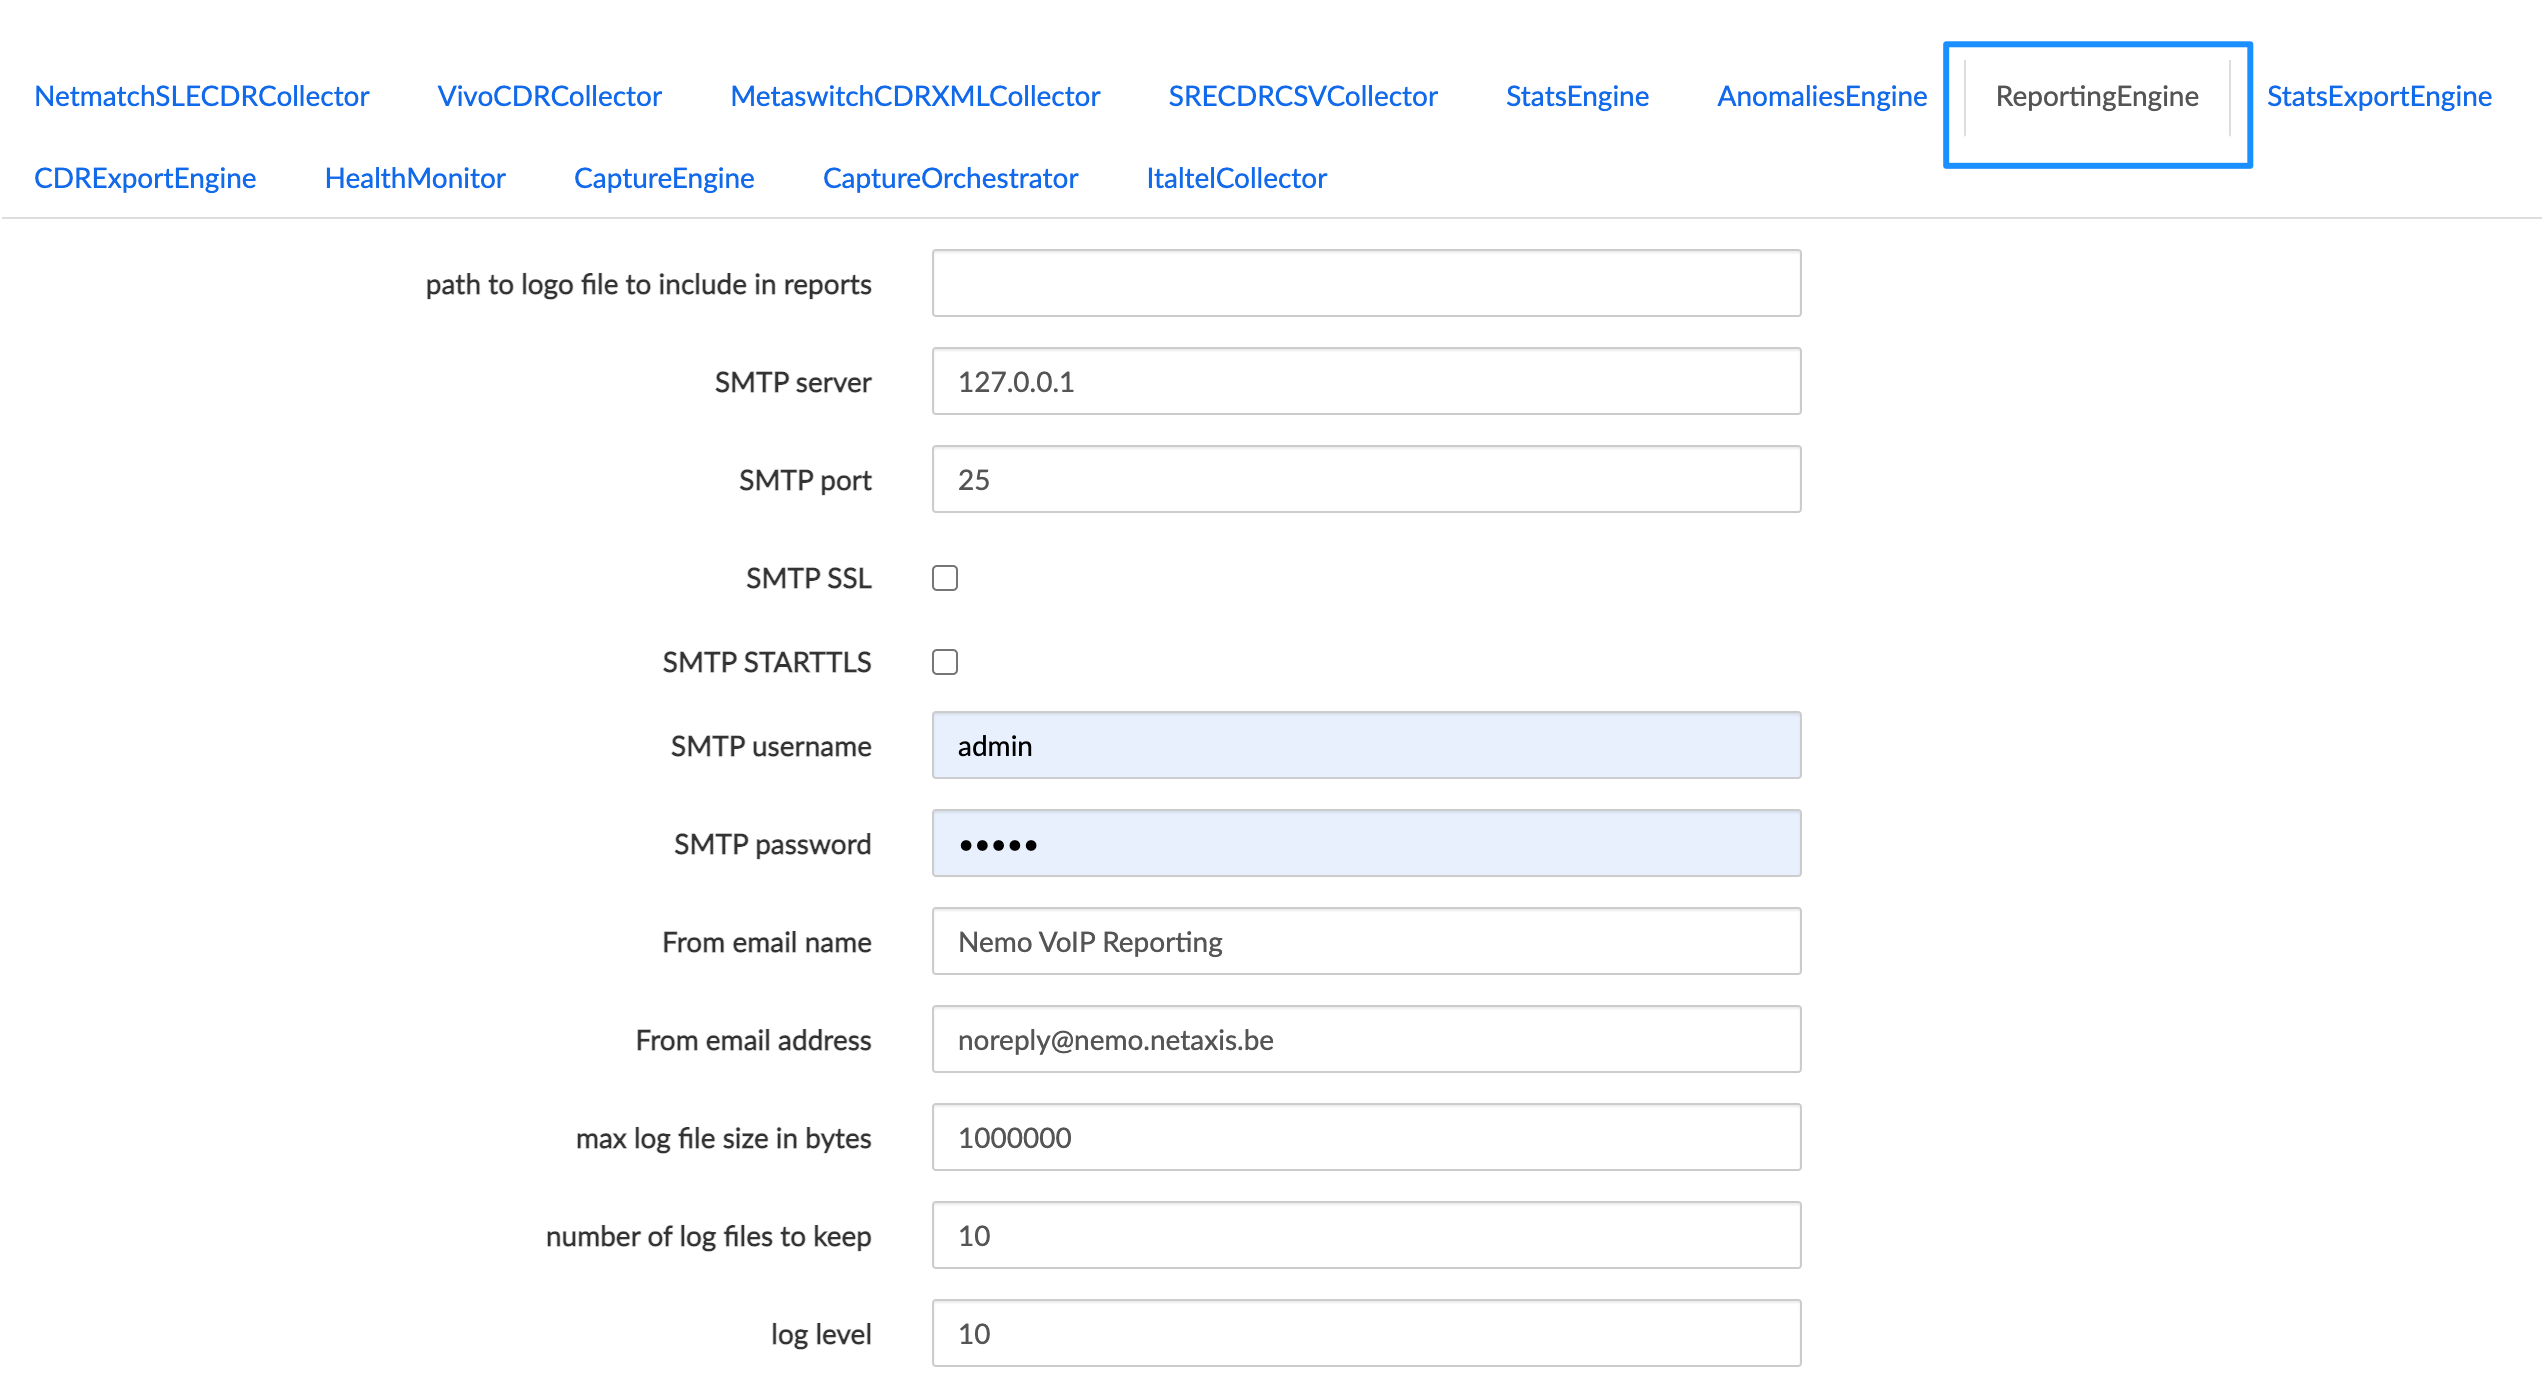
Configure the Stats Export Engine
The Statistics Export engine runs once a day to produce .csv files containing statistics raw data. The .csv files are produced per realm, endpoint, label or range. The content of the .csv file is configurable thanks to Statistics Export Profiles (see [Statistics exports]). Use the menu illustrated below to set various configuration parameters:
- SMTP server: IP address of the SMTP server where Nemo will send the traps to.
- SMTP port: destination port of the SMTP server
- SMTP SSL: flag to enable/disable to usage of SSL
- SMTP StartTLS: flag allowing to use this ancient specification to switch to encrypted mode
- SMTP username: username for SMTP connection
- SMTP password: password for SMTP connection
- From email name: name that will be displayed for the e-mail sent by Nemo.
- From email address: e-mail address for the e-mail sent by Nemo.
- max log file size in bytes: maximum size, in bytes, for the log file. Once this limit is reached, the log file is rotated and a new log file is created.
- number of log files to keep: the number of log files to keep. This includes the current one and the rotated ones.
- log level: sets the logging severity level (2: data, 5: trace, 10: debug, 20: info, 30: warning, 40: error, 50: critical)
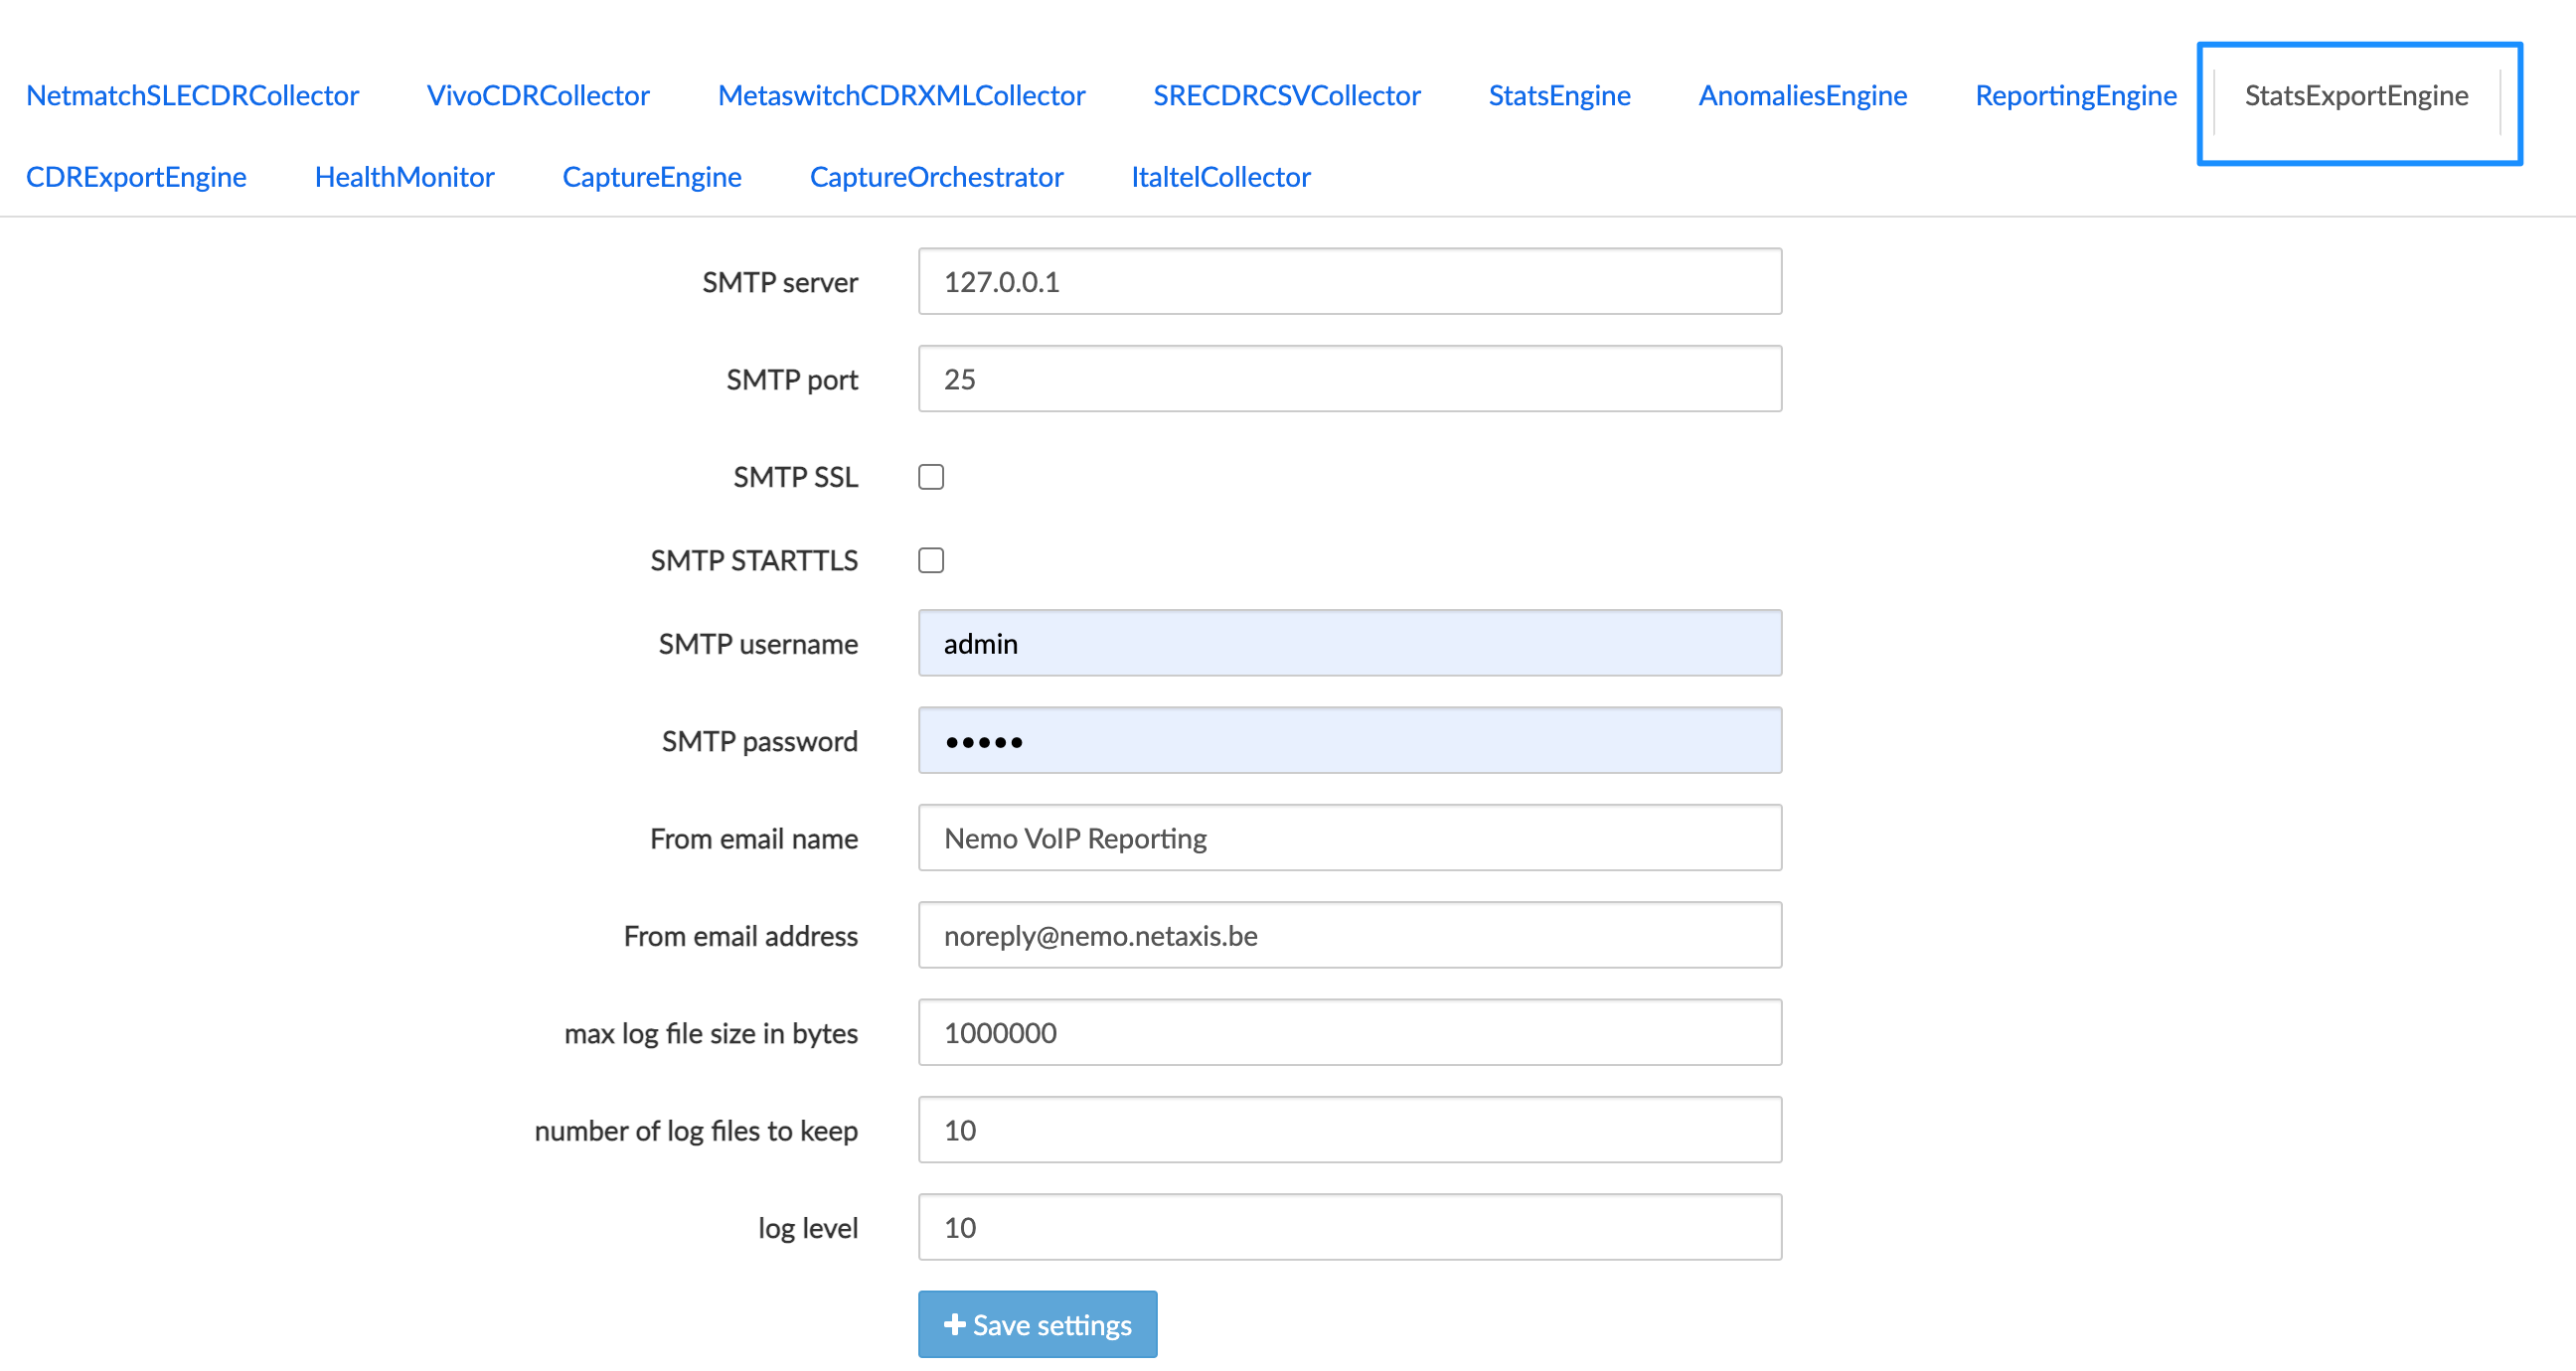
Configure the CDR Export Engine
The CDR Export engine runs once a day to produce .csv files containing CDRs. The .csv files are produced per realm, endpoint, label or range. The content of the .csv files is configurable thanks to CDR export profiles (see [CDR Exports]. Use the menu illustrated below to set various configuration parameters:
- max log file size in bytes: maximum size, in bytes, for the log file. Once this limit is reached, the log file is rotated and a new log file is created.
- number of log files to keep: this includes the current one and the rotated ones.
- log level: sets the logging severity level (2: data, 5: trace, 10: debug, 20: info, 30: warning, 40: error, 50: critical)
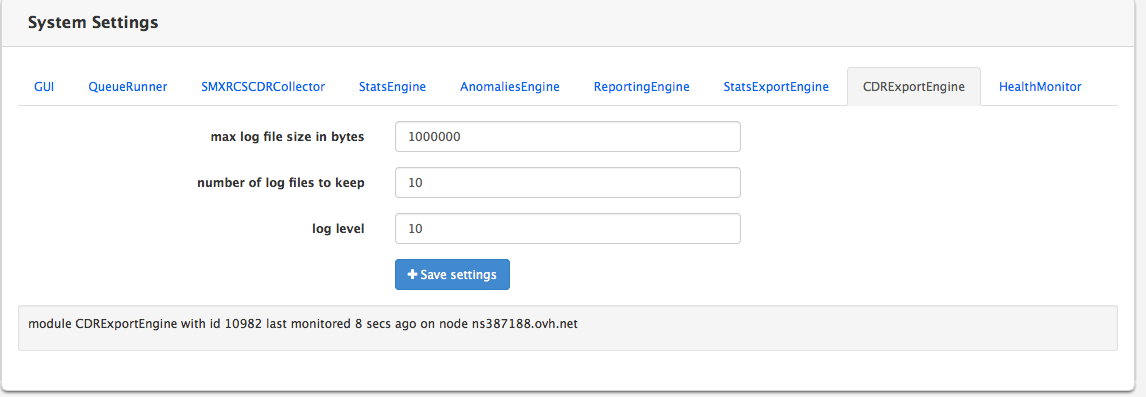
Configure the Health Monitor
The system is monitored at regular intervals to ensure the proper functioning of NEMO. Use the menu illustrated below to set various parameters:
- max log file size in bytes: maximum size, in bytes, for the log file. Once this limit is reached, the log file is rotated and a new log file is created.
- number of log files to keep: this includes the current one and the rotated ones.
- log level: sets the logging severity level (2: data, 5: trace, 10: debug, 20: info, 30: warning, 40: error, 50: critical)

Configure the Capture Engine
This operation is reserved to Netaxis support at installation and deployment time.
Configure the Capture Orchestrator
This operation is reserved to Netaxis support at installation and deployment time.
Logs
The Logs menu allows viewing the log files produced by NEMO.
Click the View button to display the log file you want to inspect, then click the Back button of your browser to go back to the NEMO Settings/Logs window.
The following log files (sorted alphabetically) are available:
anomalies_engine.log: this file contains logs produced by the "Anomalies" Engine processes. The length and the number of those files is configurable in theSettings/System/Anomalies Enginemenu.audit.log: this file contains logs about HTTP requests to NEMO module. This file rotates every day.capture_engine.log: this file contains logs produced by the Capture Engine processes, which manage the capture on probes and the transfer of probes traces to the central server. The length and the number of those files is configurable in theSettings/System/CaptureEnginemenu.CaptureOrchestrator.log: this file contains the logs produced by the CaptureOrchestrator process, which synchronizes the probe servers and saves the traces' metadata. The length and the number of those files is configurable in theSettings/System/CaptureOrchestratormenu.cdr_export_engine.log: this file contains logs produced by the "CDR Export" Engine processes. The length and the number of those files is configurable in theSettings/System/CDR Export Enginemenu.gui.log: this file contains logs produced by the "GUI" processes. The length and the number of those files is configurable in theSettings/System/GUImenu.gui_access.log: this file contains information about user access (successful/unsuccessful access). This file contains a limited amount of information. It aims to keep track of the user login attempts. This file rotates every day.gui_server.log: this file contains the information about GUI crashes. The length and the number of those files is configurable in theSettings/System/GUImenu.health_monitor.log: this file contains logs produced by the Health Monitor process, which purges the database and the file system. The length and the number of those files is configurable in theSettings/System/HealthMonitormenu.qr0.logandqr1.log: those files contain logs produced by QueueRunner processes. The length and the number of those files is configurable in theSettings/System/QueueRunnermenu.reporting_engine.log: this file contains logs produced by the "Reporting" Engine processes. The length and the number of those files is configurable in theSettings/System/Reporting Enginemenu.stats_engine.log: this file contains logs produced by the "Stats" Engine processes. The length and the number of those files is configurable in theSettings/System/Health Monitormenu.stats_export_engine.log: this file contains logs produced by the "Statistics Export" Engine processes. The length and the number of those files is configurable in theSettings/System/Stats Export Enginemenu.watchdog.log: this file contains logs produced by the watchdog processes. The length and the number of those files is configurable in theSettings/System/Health Monitormenu.
INFO
The absence of a log in the System > Logs browser window does not indicate a malfunction of the system. The most common reason for a log not being listed is that the corresponding engine is not active or the corresponding process has not been run yet.
Plugins Features List
Netaxis Probes
Plugin name: capture
Trace correlation support: yes
DB collection name: sip
Base configuration object: Probes
Sub-groups:
- Trunks
GUI Search Calls
Search Criteria
| Tab | Search Criteria |
|---|---|
| SIP | Method |
| SIP | SIP status |
| SIP | SIP headers |
| Packet Loss | Calling RTP packets lost |
| Packet Loss | Called RTP packets lost |
| Packet Loss | Calling RTP packet loss |
| Packet Loss | Called RTP packet loss |
| Packet Jitter | Calling RTP Avg jitter |
| Packet Jitter | Called RTP Avg jitter |
| Packet Jitter | Calling RTP max jitter |
| Packet Jitter | Called RTP max jitter |
| Packet Latency | Calling RTCP Avg Latency |
| Packet Latency | Called RTCP Avg Latency |
| MOS | Calling MOS |
| MOS | Called MOS |
| Media streams | Media streams count |
| User agent | Calling user agent |
| User agent | Called user agent |
Results Columns
| Column |
|---|
| Probe |
| Calling Number (normalized) |
| Called Number (normalized) |
| Src IP |
| Dst IP |
| Src Hostname |
| Dst Hostname |
| VLAN |
| Call Id |
| SIP Method |
| SIP Status |
| Alerting Duration (secs) |
| Connection Duration (secs) |
| Total Duration (secs) |
| Calling RTP Packets |
| Called RTP Packets |
| Calling RTP Packets Lost |
| Called RTP Packets Lost |
| Calling RTP Packet Loss |
| Called RTP Packet Loss |
| Calling RTP Avg Jitter |
| Called RTP Avg Jitter |
| Calling RTCP Avg Latency |
| Called RTCP Avg Latency |
| Calling MOS |
| Called MOS |
| Media streams count |
| Correlated calls count |
| Correlated calls ids |
| Correlation group id |
| Record id |
| Media codec |
| Calling user agent |
| Called user agent |
REST API
Search Criteria
| Search Criteria |
|---|
| probe |
| callingNormalized |
| calledNormalized |
| srcIp |
| dstIp |
| srcHostname |
| dstHostname |
| VLAN |
| callId |
| sipMethod |
| sipStatus |
| alertingDuration |
| connectionDuration |
| totalDuration |
| callingRTPPackets |
| calledRTPPackets |
| callingRTPPacketsLost |
| calledRTPPacketsLost |
| callingRTPPacketLoss |
| calledRTPPacketLoss |
| callingRTPAvgJitter |
| calledRTPAvgJitter |
| callingRTCPAvgLatency |
| calledRTCPAvgLatency |
| callingMOS |
| calledMOS |
| mediaStreamsCount |
| correlatedCallsCount |
| correlatedCallsIds |
| correlationGroupId |
| mediaCodec |
| callingUserAgent |
| calledUserAgent |
Search Results Fields
All the fields available for the GUI search results columns are present in REST API responses.
Exportable CDR Fields
| Tab | Field |
|---|---|
| Session | Setup Time (YYYY-MM-DD HH:MM:SS) |
| Session | Connect Time (YYYY-MM-DD HH:MM:SS) |
| Session | Disconnect time (YYYY-MM-DD HH:MM:SS) |
| Session | Calling Party Number |
| Session | Calling Party Number (normalized) |
| Session | Called Party Number |
| Session | Called Party Number (normalized) |
| Session | SIP Method |
| Session | SIP Status |
| Session | Call Id |
| Session | Probe |
| Session | Src IP |
| Session | Dst IP |
| Session | VLAN |
| Quality of Service | Calling RTP Packets |
| Quality of Service | Called RTP Packets |
| Quality of Service | Calling RTP Packets Lost |
| Quality of Service | Called RTP Packets Lost |
| Quality of Service | Calling RTP Packet Loss |
| Quality of Service | Called RTP Packet Loss |
| Quality of Service | Calling RTP Avg Jitter |
| Quality of Service | Called RTP Avg Jitter |
| Quality of Service | Calling RTCP Avg Latency |
| Quality of Service | Called RTCP Avg Latency |
| Quality of Service | Calling MOS |
| Quality of Service | Called MOS |
Exportable Statistics
| Tab | Field |
|---|---|
| Sessions | Ingress calls setup count |
| Sessions | Egress calls setup count |
| Sessions | Total calls setup count |
| Sessions | Ingress calls setup & answered count |
| Sessions | Egress calls setup & answered count |
| Sessions | Total calls setup & answered count |
| Sessions | Ingress calls disconnect count |
| Sessions | Egress calls disconnect count |
| Sessions | Total calls disconnect count |
| Sessions | Ingress traffic intensity (erlangs) |
| Sessions | Egress traffic intensity (erlangs) |
| Sessions | Total traffic intensity (erlangs) |
| Sessions | Ingress max simultaneous calls (channels) |
| Sessions | Egress max simultaneous calls (channels) |
| Sessions | Total max simultaneous calls (channels) |
| Sessions | Ingress call rate (calls/min) |
| Sessions | Egress call rate (calls/min) |
| Sessions | Total call rate (calls/min) |
| Sessions | Ingress calls ringing duration (secs) |
| Sessions | Egress calls ringing duration (secs) |
| Sessions | Ingress calls connection duration (secs) |
| Sessions | Egress calls connection duration (secs) |
| Sessions | Ingress session establishment ratio (SER/ASR) (%) |
| Sessions | Egress session establishment ratio (SER/ASR) (%) |
| Sessions | Ingress session establishment effectiveness ratio (SEER/NER) (%) |
| Sessions | Egress session establishment effectiveness ratio (SEER/NER) (%) |
| Sessions | Ingress ineffective session attempts ratio (ISA) (%) |
| Sessions | Egress ineffective session attempts ratio (ISA) (%) |
Anomalies
| Test |
|---|
| ingress calls setup count |
| egress calls setup count |
| ingress calls setup & answered count |
| egress calls setup & answered count |
| ingress calls disconnect count |
| egress calls disconnect count |
| ingress traffic intensity |
| egress traffic intensity |
| ingress traffic intensity variation (%) |
| egress traffic intensity variation (%) |
| ingress max simultaneous calls |
| egress max simultaneous calls |
| total capacity usage |
| ingress call rate |
| egress call rate |
| ingress calls ringing duration |
| egress calls ringing duration |
| ingress calls connection duration |
| egress calls connection duration |
| ingress media packet loss (RTP) |
| egress media packet loss (RTP) |
| ingress media packet jitter (RTP) |
| egress media packet jitter (RTP) |
| ingress media MOS |
| egress media MOS |
| ingress registration messages count |
| egress registrations messages count |
| ingress session establishment ratio (SER/ASR) |
| egress session establishment ratio (SER/ASR) |
| ingress session establishment effectiveness ratio (SEER/NER) |
| egress session establishment effectiveness ratio (SEER/NER) |
Custom Metrics Exposed Fields
| Field | Type |
|---|---|
| CLG_IP | string |
| CLD_IP | string |
| RELEASE_CAUSE_SIP | string |
| MEDIA_CODEC | integer |
| MEDIA_CODEC_LABEL | string |
| CLG_RTP_PACKETS | integer |
| CLG_RTP_PACKETS_LOST | integer |
| CLG_RTP_PACKET_LOSS | float |
| CLG_RTP_PACKETS_SENT | integer |
| CLG_RTP_JITTER_SUM | integer |
| CLG_RTP_JITTER_MAX | integer |
| CLG_RTP_JITTER_AVG | float |
| CLG_RTP_JITTER_PACKETS | integer |
| CLG_RTCP_LATENCY | integer |
| CLG_RTP_MOS | float |
| CLG_USER_AGENT | string |
| CLG_RTP_FRAME_BYTES | integer |
| CLG_RTP_PAYLOAD_BYTES | integer |
| CLD_RTP_PAYLOAD_BYTES | integer |
| CLD_RTP_FRAME_BYTES | integer |
| CLD_RTP_PACKETS | integer |
| CLD_RTP_PACKETS_LOST | integer |
| CLD_RTP_PACKET_LOSS | float |
| CLD_RTP_PACKETS_SENT | integer |
| CLD_RTP_JITTER_SUM | integer |
| CLD_RTP_JITTER_MAX | integer |
| CLD_RTP_JITTER_AVG | float |
| CLD_RTP_JITTER_PACKETS | integer |
| CLD_RTCP_LATENCY | integer |
| CLD_RTP_MOS | float |
| CLD_USER_AGENT | string |
Netaxis SRE
Plugin name: sre
Trace correlation support: no
DB collection name: srecdrs
Base configuration object: Call Processors
Sub-groups:
- Trunks
GUI Search Calls
Search Criteria
INFO
This plugin does not support specific search criteria except the standard ones.
Results Columns
| Column |
|---|
| Calling Number (normalized) |
| Called Number (normalized) |
| From URI |
| To URI |
| Request username |
| Request URI |
| Contact |
| Call Id |
| Counter |
| Alerting Duration (secs) |
| Connection Duration (secs) |
| Total Duration (secs) |
| Disconnect Cause |
| CDR type |
| Record Id |
REST API
Search Criteria
| Search Criteria |
|---|
| callingNormalized |
| calledNormalized |
| fromURI |
| toURI |
| requestUsername |
| requestURI |
| contact |
| callId |
| counter |
| alertingDuration |
| connectionDuration |
| totalDuration |
| disconnectCause |
| cdrType |
Search Results Fields
All the fields available for the GUI search results columns are present in REST API responses.
Exportable CDR Fields
| Tab | Field |
|---|---|
| Details | Setup Time |
| Details | Hostname |
| Details | Connect Time |
| Details | Connect Host |
| Details | Disconnect Time |
| Details | Disconnect Host |
| Details | Status Code |
| Details | Call Id |
| Details | Counter |
| Details | From |
| Details | Calling |
| Details | To |
| Details | Called |
| Details | Request URI |
| Details | Request Username |
| Details | Last Request URI |
| Details | Source Address |
| Details | Source Port |
| Details | Destination Address |
| Details | Destination Port |
| Details | Type |
| Details | Contact |
Exportable Statistics
| Tab | Field |
|---|---|
| Sessions | Ingress calls setup count |
| Sessions | Egress calls setup count |
| Sessions | Total calls setup count |
| Sessions | Ingress calls setup & answered count |
| Sessions | Egress calls setup & answered count |
| Sessions | Total calls setup & answered count |
| Sessions | Ingress calls disconnect count |
| Sessions | Egress calls disconnect count |
| Sessions | Total calls disconnect count |
| Sessions | Ingress traffic intensity (erlangs) |
| Sessions | Egress traffic intensity (erlangs) |
| Sessions | Total traffic intensity (erlangs) |
| Sessions | Ingress max simultaneous calls (channels) |
| Sessions | Egress max simultaneous calls (channels) |
| Sessions | Total max simultaneous calls (channels) |
| Sessions | Ingress call rate (calls/min) |
| Sessions | Egress call rate (calls/min) |
| Sessions | Total call rate (calls/min) |
| Sessions | Ingress calls ringing duration (secs) |
| Sessions | Egress calls ringing duration (secs) |
| Sessions | Ingress calls connection duration (secs) |
| Sessions | Egress calls connection duration (secs) |
Anomalies
| Test |
|---|
| ingress calls setup count |
| egress calls setup count |
| ingress calls setup & answered count |
| egress calls setup & answered count |
| ingress calls disconnect count |
| egress calls disconnect count |
| ingress traffic intensity |
| egress traffic intensity |
| ingress traffic intensity variation (%) |
| egress traffic intensity variation (%) |
| ingress max simultaneous calls |
| egress max simultaneous calls |
| total capacity usage |
| ingress call rate |
| egress call rate |
| ingress calls ringing duration |
| egress calls ringing duration |
| ingress calls connection duration |
| egress calls connection duration |
Custom Metrics Exposed Fields
INFO
This plugin does not support any specific CDR field for custom metrics, except the standard ones.
Oracle SBC
Plugin name: netnetsd
Trace correlation support: yes
DB collection name: sbccdrs
Base configuration object: Session Border Controllers
Sub-groups:
- Realms
- Endpoints
- Source Ranges
- Destination Ranges
GUI Search Calls
Search Criteria
| Tab | Search Criteria |
|---|---|
| Packet Loss | Calling RTP packets lost |
| Packet Loss | Called RTP packets lost |
| Packet Loss | Calling RTP packet loss |
| Packet Loss | Called RTP packet loss |
| Packet Loss | Calling RTCP packets lost |
| Packet Loss | Called RTCP packets lost |
| Packet Loss | Calling RTCP packet loss |
| Packet Loss | Called RTCP packet loss |
| Packet Jitter | Calling RTP Avg jitter |
| Packet Jitter | Called RTP Avg jitter |
| Packet Jitter | Calling RTCP Avg jitter |
| Packet Jitter | Called RTCP Avg jitter |
| Packet Jitter | Calling RTP max jitter |
| Packet Jitter | Called RTP max jitter |
| Packet Jitter | Calling RTCP max jitter |
| Packet Jitter | Called RTCP max jitter |
| Packet Latency | Calling RTCP Avg Latency |
| Packet Latency | Called RTCP Avg Latency |
| Packet Latency | Calling RTCP max Latency |
| Packet Latency | Called RTCP max Latency |
| MOS | Calling MOS |
| MOS | Called MOS |
| SIP | SIP status |
| SIP | P-Asserted-Id |
| SIP | Primary Routing Number |
| SIP | Egress Final Routing Number |
| SIP | SIP Diversion |
Results Columns
| Column |
|---|
| Calling Number (normalized) |
| Called Number (normalized) |
| Ingress Remote Address |
| Egress Remote Address |
| Ingress Local Address |
| Egress Local Address |
| Alerting Duration (secs) |
| Connection Duration (secs) |
| Total Duration (secs) |
| Post Dial Delay (msecs) |
| Disconnect Cause |
| SIP Status |
| Codec (forward stream) |
| Codec (reverse stream) |
| Calling RTP Packets Lost |
| Called RTP Packets Lost |
| Calling RTP Packet Loss |
| Called RTP Packet Loss |
| Calling RTCP Packets Lost |
| Called RTCP Packets Lost |
| Calling RTCP Packet Loss |
| Called RTCP Packet Loss |
| Calling RTP Avg Jitter (msecs) |
| Called RTP Avg Jitter (msecs) |
| Calling RTCP Avg Jitter (msecs) |
| Called RTCP Avg Jitter (msecs) |
| Calling RTP Max Jitter (msecs) |
| Called RTP Max Jitter (msecs) |
| Calling RTCP Max Jitter (msecs) |
| Called RTCP Max Jitter (msecs) |
| Calling RTCP Avg Latency (msecs) |
| Called RTCP Avg Latency (msecs) |
| Calling RTCP Max Latency (msecs) |
| Called RTCP Max Latency (msecs) |
| Calling MOS |
| Called MOS |
| P-Asserted-Id |
| Primary Routing Number |
| Egress Final Routing Number |
| SIP Diversion |
REST API
Search Criteria
| Search Criteria |
|---|
| callingNormalized |
| calledNormalized |
| ingressRemoteAddress |
| egressRemoteAddress |
| ingressLocalAddress |
| egressLocalAddress |
| alertingDuration |
| connectionDuration |
| totalDuration |
| postDialDelay |
| disconnectCause |
| sipStatus |
| codecForwardStream |
| codecReverseStream |
| callingRTPPacketsLost |
| calledRTPPacketsLost |
| callingRTPPacketLoss |
| calledRTPPacketLoss |
| callingRTCPPacketsLost |
| calledRTCPPacketsLost |
| callingRTCPPacketLoss |
| calledRTCPPacketLoss |
| callingRTPAvgJitter |
| calledRTPAvgJitter |
| callingRTCPAvgJitter |
| calledRTCPAvgJitter |
| callingRTPMaxJitter |
| calledRTPMaxJitter |
| callingRTCPMaxJitter |
| calledRTCPMaxJitter |
| callingRTCPAvgLatency |
| calledRTCPAvgLatency |
| callingRTCPMaxLatency |
| calledRTCPMaxLatency |
| callingMOS |
| calledMOS |
| pAssertedId |
| primaryRoutingNumber |
| egressFinalRoutingNumber |
| sipDiversion |
Search Results Fields
All the fields available for the GUI search results columns are present in REST API responses.
Exportable CDR Fields
| Tab | Field |
|---|---|
| Session | Setup Time (YYYY-MM-DD HH:MM:SS) |
| Session | Connect Time (YYYY-MM-DD HH:MM:SS) |
| Session | Disconnect time (YYYY-MM-DD HH:MM:SS) |
| Session | Post Dial Delay |
| Session | Session Protocol Type |
| Session | Calling Station Id |
| Session | Calling Party Number |
| Session | Called Station Id |
| Session | Called Party Number |
| Session | P-Asserted-Id |
| Session | Primary Routing Number |
| Session | Egress Final Routing Number |
| Session | SIP Diversion |
| Session | Disconnect Initiator |
| Session | Disconnect Cause |
| Session | SIP Status |
| Session | Originating Trunk Group |
| Session | Terminating Trunk Group |
| Session | Originating Trunk Context |
| Session | Terminating Trunk Context |
| Signaling | Session Ingress Realm |
| Signaling | Session Egress Realm |
| Signaling | Session Ingress Call Id |
| Signaling | Session Egress Call Id |
| Signaling | Ingress Local Address |
| Signaling | Ingress Remote Address |
| Signaling | Egress Local Address |
| Signaling | Egress Remote Address |
| Signaling | Ingress Network Interface Id |
| Signaling | Ingress Vlan Tag Value |
| Signaling | Egress Network Interface Id |
| Signaling | Egress Vlan Tag Value |
| Forward Media Stream | Flow Id |
| Forward Media Stream | Flow Type |
| Forward Media Stream | Flow In Realm |
| Forward Media Stream | Flow In Source Address |
| Forward Media Stream | Flow In Source Port |
| Forward Media Stream | Flow In Destination Address |
| Forward Media Stream | Flow In Destination Port |
| Forward Media Stream | Flow Out Realm |
| Forward Media Stream | Flow Out Source Address |
| Forward Media Stream | Flow Out Source Port |
| Forward Media Stream | Flow Out Destination Address |
| Forward Media Stream | Flow Out Destination Port |
| Forward Media Stream | Calling Octets |
| Forward Media Stream | Calling Packets |
| Forward Media Stream | Calling RTCP Packets Lost |
| Forward Media Stream | Calling RTCP Avg Jitter |
| Forward Media Stream | Calling RTCP Avg Latency |
| Forward Media Stream | Calling RTCP MaxJitter |
| Forward Media Stream | Calling RTCP MaxLatency |
| Forward Media Stream | Calling RTP Packets Lost |
| Forward Media Stream | Calling RTP Avg Jitter |
| Forward Media Stream | Calling RTP MaxJitter |
| Forward Media Stream | Calling R Factor |
| Forward Media Stream | Calling MOS |
| Reverse Media Stream | Flow Id |
| Reverse Media Stream | Flow Type |
| Reverse Media Stream | Flow In Realm |
| Reverse Media Stream | Flow In Source Address |
| Reverse Media Stream | Flow In Source Port |
| Reverse Media Stream | Flow In Destination Address |
| Reverse Media Stream | Flow In Destination Port |
| Reverse Media Stream | Flow Out Realm |
| Reverse Media Stream | Flow Out Source Address |
| Reverse Media Stream | Flow Out Source Port |
| Reverse Media Stream | Flow Out Destination Address |
| Reverse Media Stream | Flow Out Destination Port |
| Reverse Media Stream | Called Octets |
| Reverse Media Stream | Called Packets |
| Reverse Media Stream | Called RTCP Packets Lost |
| Reverse Media Stream | Called RTCP Avg Jitter |
| Reverse Media Stream | Called RTCP Avg Latency |
| Reverse Media Stream | Called RTCP MaxJitter |
| Reverse Media Stream | Called RTCP MaxLatency |
| Reverse Media Stream | Called RTP Packets Lost |
| Reverse Media Stream | Called RTP Avg Jitter |
| Reverse Media Stream | Called RTP MaxJitter |
| Reverse Media Stream | Called R Factor |
| Reverse Media Stream | Called MOS |
Exportable Statistics
| Tab | Field |
|---|---|
| Sessions | Ingress calls setup count |
| Sessions | Egress calls setup count |
| Sessions | Total calls setup count |
| Sessions | Ingress calls setup & answered count |
| Sessions | Egress calls setup & answered count |
| Sessions | Total calls setup & answered count |
| Sessions | Ingress calls disconnect count |
| Sessions | Egress calls disconnect count |
| Sessions | Total calls disconnect count |
| Sessions | Ingress traffic intensity (erlangs) |
| Sessions | Egress traffic intensity (erlangs) |
| Sessions | Total traffic intensity (erlangs) |
| Sessions | Ingress max simultaneous calls (channels) |
| Sessions | Egress max simultaneous calls (channels) |
| Sessions | Total max simultaneous calls (channels) |
| Sessions | Ingress call rate (calls/min) |
| Sessions | Egress call rate (calls/min) |
| Sessions | Total call rate (calls/min) |
| Sessions | Ingress calls ringing duration (secs) |
| Sessions | Egress calls ringing duration (secs) |
| Sessions | Ingress calls connection duration (secs) |
| Sessions | Egress calls connection duration (secs) |
| Sessions | Ingress session establishment ratio (SER/ASR) (%) |
| Sessions | Egress session establishment ratio (SER/ASR) (%) |
| Sessions | Ingress session establishment effectiveness ratio (SEER/NER) (%) |
| Sessions | Egress session establishment effectiveness ratio (SEER/NER) (%) |
| Sessions | Ingress ineffective session attempts ratio (ISA) (%) |
| Sessions | Egress ineffective session attempts ratio (ISA) (%) |
| Sessions | Ingress post dial delay (PDD) (msecs) |
| Sessions | Egress post dial delay (PDD) (msecs) |
| Voice quality | Ingress media packet loss (RTCP) (%) |
| Voice quality | Egress media packet loss (RTCP) (%) |
| Voice quality | Ingress media packet loss (RTP) (%) |
| Voice quality | Egress media packet loss (RTP) (%) |
| Voice quality | Ingress media packet jitter (RTCP) (msecs) |
| Voice quality | Egress media packet jitter (RTCP) (msecs) |
| Voice quality | Ingress media packet jitter (RTP) (msecs) |
| Voice quality | Egress media packet jitter (RTP) (msecs) |
| Voice quality | Ingress media packet latency (RTCP) (msecs) |
| Voice quality | Egress media packet latency (RTCP) (msecs) |
| Voice quality | Ingress media MOS (score) |
| Voice quality | Egress media MOS (score) |
| Voice quality | Ingress media bandwidth (kbit/s) |
| Voice quality | Egress media bandwidth (kbit/s) |
Anomalies
| Test |
|---|
| ingress calls setup count |
| egress calls setup count |
| ingress calls setup & answered count |
| egress calls setup & answered count |
| ingress calls disconnect count |
| egress calls disconnect count |
| ingress traffic intensity |
| egress traffic intensity |
| ingress traffic intensity variation (%) |
| egress traffic intensity variation (%) |
| ingress max simultaneous calls |
| egress max simultaneous calls |
| total capacity usage |
| ingress call rate |
| egress call rate |
| ingress calls ringing duration |
| egress calls ringing duration |
| ingress calls connection duration |
| egress calls connection duration |
| ingress media packet loss (RTCP) |
| egress media packet loss (RTCP) |
| ingress media packet loss (RTP) |
| egress media packet loss (RTP) |
| ingress media packet jitter (RTCP) |
| egress media packet jitter (RTCP) |
| ingress media packet jitter (RTP) |
| egress media packet jitter (RTP) |
| ingress media packet latency (RTCP) |
| egress media packet latency (RTCP) |
| ingress media MOS |
| egress media MOS |
| ingress media bandwidth |
| egress media bandwidth |
| ingress session establishment ratio (SER/ASR) |
| egress session establishment ratio (SER/ASR) |
| ingress session establishment effectiveness ratio (SEER/NER) |
| egress session establishment effectiveness ratio (SEER/NER) |
| ingress ineffective session attempts ratio (ISA) |
| egress ineffective session attempts ratio (ISA) |
| ingress post dial delay (PDD) |
| egress post dial delay (PDD) |
Custom Metrics Exposed Fields
| Field | Type |
|---|---|
| NAS_IP_ADDRESS | string |
| NAS_PORT | integer |
| NAS_IDENTIFIER | string |
| CALLED_STATION_ID | string |
| CALLING_STATION_ID | string |
| H323_SETUP_TIME | string |
| H323_CONNECT_TIME | string |
| H323_DISCONNECT_TIME | string |
| H323_DISCONNECT_CAUSE | string |
| FLOWID_FS1_F | string |
| FLOWTYPE_FS1_F | string |
| SESSION_INGRESS_CALLID | string |
| SESSION_EGRESS_CALLID | string |
| FLOW_IN_REALM_FS1_F | string |
| FLOW_IN_SRC_ADDR_FS1_F | string |
| FLOW_IN_SRC_PORT_FS1_F | integer |
| FLOW_IN_DST_ADDR_FS1_F | string |
| FLOW_IN_DST_PORT_FS1_F | integer |
| FLOW_OUT_REALM_FS1_F | string |
| FLOW_OUT_SRC_ADDR_FS1_F | string |
| FLOW_OUT_SRC_PORT_FS1_F | integer |
| FLOW_OUT_DST_ADDR_FS1_F | string |
| FLOW_OUT_DST_PORT_FS1_F | integer |
| CALLING_OCTETS_FS1 | integer |
| CALLING_PACKETS_FS1 | integer |
| CALLING_RTCP_PACKETS_LOST_FS1 | integer |
| CALLING_RTCP_AVG_JITTER_FS1 | integer |
| CALLING_RTCP_AVG_LATENCY_FS1 | integer |
| CALLING_RTCP_MAXJITTER_FS1 | integer |
| CALLING_RTCP_MAXLATENCY_FS1 | integer |
| CALLING_RTP_PACKETS_LOST_FS1 | integer |
| CALLING_RTP_AVG_JITTER_FS1 | integer |
| CALLING_RTP_MAXJITTER_FS1 | integer |
| SESSION_GENERIC_ID | string |
| SESSION_INGRESS_REALM | string |
| SESSION_EGRESS_REALM | string |
| SESSION_PROTOCOL_TYPE | string |
| CALLED_OCTETS_FS1 | integer |
| CALLED_PACKETS_FS1 | integer |
| CALLED_RTCP_PACKETS_LOST_FS1 | integer |
| CALLED_RTCP_AVG_JITTER_FS1 | integer |
| CALLED_RTCP_AVG_LATENCY_FS1 | integer |
| CALLED_RTCP_MAXJITTER_FS1 | integer |
| CALLED_RTCP_MAXLATENCY_FS1 | integer |
| CALLED_RTP_PACKETS_LOST_FS1 | integer |
| CALLED_RTP_AVG_JITTER_FS1 | integer |
| CALLED_RTP_MAXJITTER_FS1 | integer |
| SESSION_CHARGING_VECTOR | string |
| SESSION_CHARGING_FUNCTION_ADDRESS | string |
| FIRMWARE_VERSION | string |
| LOCAL_TIME_ZONE | string |
| POST_DIAL_DELAY | integer |
| CDR_SEQUENCE_NUMBER | integer |
| SESSION_DISPOSITION | integer |
| DISCONNECT_INITIATOR | integer |
| DISCONNECT_CAUSE | integer |
| INTERMEDIATE_TIME | string |
| PRIMARY_ROUTING_NUMBER | string |
| ORIGINATING_TRUNK_GROUP | string |
| TERMINATING_TRUNK_GROUP | string |
| ORIGINATING_TRUNK_CONTEXT | string |
| TERMINATING_TRUNK_CONTEXT | string |
| P_ASSERTED_ID | string |
| SIP_DIVERSION | string |
| SIP_STATUS | integer |
| INGRESS_LOCAL_ADDR | string |
| INGRESS_REMOTE_ADDR | string |
| EGRESS_LOCAL_ADDR | string |
| EGRESS_REMOTE_ADDR | string |
| FLOWID_FS1_R | string |
| FLOWTYPE_FS1_R | string |
| FLOW_IN_REALM_FS1_R | string |
| FLOW_IN_SRC_ADDR_FS1_R | string |
| FLOW_IN_SRC_PORT_FS1_R | integer |
| FLOW_IN_DST_ADDR_FS1_R | string |
| FLOW_IN_DST_PORT_FS1_R | integer |
| FLOW_OUT_REALM_FS1_R | string |
| FLOW_OUT_SRC_ADDR_FS1_R | string |
| FLOW_OUT_SRC_PORT_FS1_R | integer |
| FLOW_OUT_DST_ADDR_FS1_R | string |
| FLOW_OUT_DST_PORT_FS1_R | integer |
| FLOWID_FS2_F | string |
| FLOWTYPE_FS2_F | string |
| FLOW_IN_REALM_FS2_F | string |
| FLOW_IN_SRC_ADDR_FS2_F | string |
| FLOW_IN_SRC_PORT_FS2_F | integer |
| FLOW_IN_DST_ADDR_FS2_F | string |
| FLOW_IN_DST_PORT_FS2_F | integer |
| FLOW_OUT_REALM_FS2_F | string |
| FLOW_OUT_SRC_ADDR_FS2_F | string |
| FLOW_OUT_SRC_PORT_FS2_F | integer |
| FLOW_OUT_DST_ADDR_FS2_F | string |
| FLOW_OUT_DST_PORT_FS2_F | integer |
| CALLING_OCTETS_FS2 | integer |
| CALLING_PACKETS_FS2 | integer |
| CALLING_RTCP_PACKETS_LOST_FS2 | integer |
| CALLING_RTCP_AVG_JITTER_FS2 | integer |
| CALLING_RTCP_AVG_LATENCY_FS2 | integer |
| CALLING_RTCP_MAXJITTER_FS2 | integer |
| CALLING_RTCP_MAXLATENCY_FS2 | integer |
| CALLING_RTP_PACKETS_LOST_FS2 | integer |
| CALLING_RTP_AVG_JITTER_FS2 | integer |
| CALLING_RTP_MAXJITTER_FS2 | integer |
| FLOWID_FS2_R | string |
| FLOWTYPE_FS2_R | string |
| FLOW_IN_REALM_FS2_R | string |
| FLOW_IN_SRC_ADDR_FS2_R | string |
| FLOW_IN_SRC_PORT_FS2_R | integer |
| FLOW_IN_DST_ADDR_FS2_R | string |
| FLOW_IN_DST_PORT_FS2_R | integer |
| FLOW_OUT_REALM_FS2_R | string |
| FLOW_OUT_SRC_ADDR_FS2_R | string |
| FLOW_OUT_SRC_PORT_FS2_R | integer |
| FLOW_OUT_DST_ADDR_FS2_R | string |
| FLOW_OUT_DST_PORT_FS2_R | integer |
| CALLED_OCTETS_FS2 | integer |
| CALLED_PACKETS_FS2 | integer |
| CALLED_RTCP_PACKETS_LOST_FS2 | integer |
| CALLED_RTCP_AVG_JITTER_FS2 | integer |
| CALLED_RTCP_AVG_LATENCY_FS2 | integer |
| CALLED_RTCP_MAXJITTER_FS2 | integer |
| CALLED_RTCP_MAXLATENCY_FS2 | integer |
| CALLED_RTP_PACKETS_LOST_FS2 | integer |
| CALLED_RTP_AVG_JITTER_FS2 | integer |
| CALLED_RTP_MAXJITTER_FS2 | integer |
| EGRESS_FINAL_ROUTING_NUMBER | string |
| INGRESS_NETWORK_INTERFACE_ID | string |
| INGRESS_VLAN_TAG_VALUE | integer |
| EGRESS_NETWORK_INTERFACE_ID | string |
| EGRESS_VLAN_TAG_VALUE | integer |
| CALLING_R_FACTOR | integer |
| CALLING_MOS | integer |
| CALLED_R_FACTOR | integer |
| CALLED_MOS | integer |
| CUSTOM_VSA_200 | string |
| CUSTOM_VSA_201 | string |
| CUSTOM_VSA_202 | string |
| CUSTOM_VSA_203 | string |
| CUSTOM_VSA_204 | string |
| CUSTOM_VSA_205 | string |
| CUSTOM_VSA_206 | string |
| CUSTOM_VSA_207 | string |
| CUSTOM_VSA_208 | string |
| CUSTOM_VSA_209 | string |
| CUSTOM_VSA_210 | string |
| CUSTOM_VSA_211 | string |
| CUSTOM_VSA_212 | string |
| CUSTOM_VSA_213 | string |
| CUSTOM_VSA_214 | string |
| CUSTOM_VSA_215 | string |
| CUSTOM_VSA_216 | string |
| CUSTOM_VSA_217 | string |
| CUSTOM_VSA_218 | string |
| CUSTOM_VSA_219 | string |
| CUSTOM_VSA_220 | string |
| CUSTOM_VSA_221 | string |
| CUSTOM_VSA_222 | string |
| CUSTOM_VSA_223 | string |
| CUSTOM_VSA_224 | string |
| CUSTOM_VSA_225 | string |
| CUSTOM_VSA_226 | string |
| CUSTOM_VSA_227 | string |
| CUSTOM_VSA_228 | string |
| CUSTOM_VSA_229 | string |
| CUSTOM_VSA_230 | string |
Cisco Broadworks
Plugin name: broadsoft
Trace correlation support: yes
DB collection name: bwcdrs
Base configuration object: Application Servers
Sub-groups:
- Service Providers
- Groups
GUI Search Calls
Search Criteria
| Tab | Search Criteria |
|---|---|
| Additional | Line type |
Results Columns
| Column |
|---|
| Calling Number (normalized) |
| Called Number (normalized) |
| Direction |
| Alerting Duration (secs) |
| Connection Duration (secs) |
| Total Duration (secs) |
| User id |
| User number |
| Other party name |
| Dialed digits |
| Termination cause |
| Releasing party |
| Answer indicator |
| Redirecting number |
| Redirecting reason |
| Transfer type |
| Network type |
| Network call type |
| Type of network |
| Network call-id |
| Access call-id |
| Local call-id |
| Remote call-id |
| Related call-id |
| Transfer related call-id |
| Route |
| AS call type |
| Line type |
| Record id |
REST API
Search Criteria
| Search Criteria |
|---|
| callingNormalized |
| calledNormalized |
| direction |
| alertingDuration |
| connectionDuration |
| totalDuration |
| userID |
| userNumber |
| otherPartyName |
| dialedDigits |
| releaseCause |
| releaseParty |
| answerIndicator |
| redirectingNumber |
| redirectingReason |
| transferType |
| networkType |
| networkCallType |
| typeOfNetwork |
| networkCallId |
| accessCallId |
| localCallId |
| remoteCallId |
| relatedCallId |
| transferRelatedCallId |
| route |
| ASCallType |
| lineType |
Search Results Fields
All the fields available for the GUI search results columns are present in REST API responses.
Exportable CDR Fields
| Tab | Field |
|---|---|
| Session | Setup Time (YYYY-MM-DD HH:MM:SS) |
| Session | Connect Time (YYYY-MM-DD HH:MM:SS) |
| Session | Disconnect time (YYYY-MM-DD HH:MM:SS) |
| Session | Direction |
| Session | Service provider |
| Session | Group |
| Session | Group number |
| Session | User id |
| Session | User number |
| Session | Calling number |
| Session | Dialed digits |
| Session | Called number |
| Session | Calling presentation Indicator |
| Session | Calling party category |
| Session | Call category |
| Session | Network translated group |
| Session | Network translated number |
| Session | Record id |
| Session | Local call id |
| Session | Access call id |
| Session | Network call id |
| Session | Access device address |
| Session | Route |
| Session | Network type |
| Session | Network call type |
| Session | Type of network |
| Session | Termination cause |
| Session | Releasing party |
| Session | Line type |
Exportable Statistics
| Tab | Field |
|---|---|
| Sessions | Ingress calls setup count |
| Sessions | Egress calls setup count |
| Sessions | Total calls setup count |
| Sessions | Ingress calls setup & answered count |
| Sessions | Egress calls setup & answered count |
| Sessions | Total calls setup & answered count |
| Sessions | Ingress calls disconnect count |
| Sessions | Egress calls disconnect count |
| Sessions | Total calls disconnect count |
| Sessions | Ingress traffic intensity (erlangs) |
| Sessions | Egress traffic intensity (erlangs) |
| Sessions | Total traffic intensity (erlangs) |
| Sessions | Ingress max simultaneous calls (channels) |
| Sessions | Egress max simultaneous calls (channels) |
| Sessions | Total max simultaneous calls (channels) |
| Sessions | Ingress call rate (calls/min) |
| Sessions | Egress call rate (calls/min) |
| Sessions | Total call rate (calls/min) |
| Sessions | Ingress calls ringing duration (secs) |
| Sessions | Egress calls ringing duration (secs) |
| Sessions | Ingress calls connection duration (secs) |
| Sessions | Egress calls connection duration (secs) |
Anomalies
| Test |
|---|
| ingress calls setup count |
| egress calls setup count |
| ingress calls setup & answered count |
| egress calls setup & answered count |
| ingress calls disconnect count |
| egress calls disconnect count |
| ingress traffic intensity |
| egress traffic intensity |
| ingress traffic intensity variation (%) |
| egress traffic intensity variation (%) |
| ingress max simultaneous calls |
| egress max simultaneous calls |
| total capacity usage |
| ingress call rate |
| egress call rate |
| ingress calls ringing duration |
| egress calls ringing duration |
| ingress calls connection duration |
| egress calls connection duration |
Custom Metrics Exposed Fields
| Field | Type |
|---|---|
| BWXML_DIRECTION | string |
| BWXML_USERID | string |
| BWXML_USERNUMBER | string |
| BWXML_OTHERPARTYNAME | string |
| BWXML_DIALEDDIGITS | string |
| BWXML_TERMINATIONCAUSE | string |
| BWXML_RELEASINGPARTY | string |
| BWXML_ANSWERINDICATOR | string |
| BWXML_REDIRECTINGNUMBER | string |
| BWXML_REDIRECTINGREASON | string |
| BWXML_NETWORKTYPE | string |
| BWXML_NETWORKCALLTYPE | string |
| BWXML_TYPEOFNETWORK | string |
| BWXML_NETWORKCALLID | string |
| BWXML_ACCESSCALLID | string |
| BWXML_LOCALCALLID | string |
| BWXML_REMOTECALLID | string |
| BWXML_RELATEDCALLID | string |
| BWXML_ROUTE | string |
| BWXML_ASCALLTYPE | string |
| BW_E_REDIRECTED | string |
| BW_LINE_TYPE | string |
Audiocodes Mediant
Plugin name: mediant
Trace correlation support: no
DB collection name: mediantcdrs
Base configuration object: Session Border Controllers
Sub-groups:
- SRDs
- IP Groups
- IP Addresses
GUI Search Calls
Search Criteria
INFO
This plugin does not support specific search criteria except the standard ones.
Results Columns
| Column |
|---|
| SIP Status |
| Ingress IP Group |
| Egress IP Group |
| Ingress Remote Address |
| Egress Remote Address |
| Ingress SBC Address |
| Egress SBC Address |
| Calling Ingress RTP Packets |
| Calling Egress RTP Packets |
| Called Ingress RTP Packets |
| Called Egress RTP Packets |
| Calling Ingress RTP Packets Lost |
| Calling Egress RTP Packets Lost |
| Called Ingress RTP Packets Lost |
| Called Egress RTP Packets Lost |
| Calling RTP Avg Jitter |
| Called RTP Avg Jitter |
| Calling RTCP Avg Latency |
| Called RTCP Avg Latency |
| Calling Ingress MOS |
| Calling Egress MOS |
| Called Ingress MOS |
| Called Egress MOS |
REST API
Search Criteria
INFO
This plugin does not support specific search results columns except the standard ones.
Search Results Fields
All the fields available for the GUI search results columns are present in REST API responses.
Exportable CDR Fields
| Tab | Field |
|---|---|
| Session | Setup Time (YYYY-MM-DD HH:MM:SS) |
| Session | Connect Time (YYYY-MM-DD HH:MM:SS) |
| Session | Disconnect time (YYYY-MM-DD HH:MM:SS) |
| Session | SIP Method |
| Session | SIP Status |
| Session | Calling Number (normalized) |
| Session | Called Number (normalized) |
| Session | SIP Call-Id Calling |
| Session | SIP Call-Id Called |
| Session | Session Id |
| Session | Calling URI |
| Session | Calling URI before manipulation |
| Session | Called URI |
| Session | Called URI before manipulation |
| Session | Redirecting URI |
| Session | Redirecting URI before manipulation |
| Session | Ingress IP Group |
| Session | Egress IP Group |
| Session | Ingress Remote Address |
| Session | Egress Remote Address |
| Session | Ingress SBC Address |
| Session | Egress SBC Address |
| Voice Quality | Calling Ingress RTP Packets |
| Voice Quality | Calling Egress RTP Packets |
| Voice Quality | Called Ingress RTP Packets |
| Voice Quality | Called Egress RTP Packets |
| Voice Quality | Calling Ingress RTP Packets Lost |
| Voice Quality | Calling Egress RTP Packets Lost |
| Voice Quality | Called Ingress RTP Packets Lost |
| Voice Quality | Called Egress RTP Packets Lost |
| Voice Quality | Calling RTP Avg Jitter |
| Voice Quality | Called RTP Avg Jitter |
| Voice Quality | Calling RTCP Avg Latency |
| Voice Quality | Called RTCP Avg Latency |
| Voice Quality | Calling Ingress MOS |
| Voice Quality | Calling Egress MOS |
| Voice Quality | Called Ingress MOS |
| Voice Quality | Called Egress MOS |
Exportable Statistics
| Tab | Field |
|---|---|
| Sessions | Ingress calls setup count |
| Sessions | Egress calls setup count |
| Sessions | Total calls setup count |
| Sessions | Ingress calls setup & answered count |
| Sessions | Egress calls setup & answered count |
| Sessions | Total calls setup & answered count |
| Sessions | Ingress calls disconnect count |
| Sessions | Egress calls disconnect count |
| Sessions | Total calls disconnect count |
| Sessions | Ingress traffic intensity (erlangs) |
| Sessions | Egress traffic intensity (erlangs) |
| Sessions | Total traffic intensity (erlangs) |
| Sessions | Ingress max simultaneous calls (channels) |
| Sessions | Egress max simultaneous calls (channels) |
| Sessions | Total max simultaneous calls (channels) |
| Sessions | Ingress call rate (calls/min) |
| Sessions | Egress call rate (calls/min) |
| Sessions | Total call rate (calls/min) |
| Sessions | Ingress calls ringing duration (secs) |
| Sessions | Egress calls ringing duration (secs) |
| Sessions | Ingress calls connection duration (secs) |
| Sessions | Egress calls connection duration (secs) |
Anomalies
| Test |
|---|
| ingress calls setup count |
| egress calls setup count |
| ingress calls setup & answered count |
| egress calls setup & answered count |
| ingress calls disconnect count |
| egress calls disconnect count |
| ingress traffic intensity |
| egress traffic intensity |
| ingress traffic intensity variation (%) |
| egress traffic intensity variation (%) |
| ingress max simultaneous calls |
| egress max simultaneous calls |
| total capacity usage |
| ingress call rate |
| egress call rate |
| ingress calls ringing duration |
| egress calls ringing duration |
| ingress calls connection duration |
| egress calls connection duration |
| ingress media packet loss (RTCP) |
| egress media packet loss (RTCP) |
| ingress media packet loss (RTP) |
| egress media packet loss (RTP) |
| ingress media packet jitter |
| egress media packet jitter |
| ingress media packet latency (RTCP) |
| egress media packet latency (RTCP) |
| ingress media MOS |
| egress media MOS |
| ingress media bandwidth |
| egress media bandwidth |
Custom Metrics Exposed Fields
INFO
This plugin does not support any specific CDR field for custom metrics, except the standard ones.
Metaswitch
Plugin name: metaswitch
Trace correlation support: yes
DB collection name: metaswitchcdrs
Base configuration object: Equipments
Sub-groups:
- Trunks
- Source Ranges
GUI Search Calls
Search Criteria
| Tab | Search Criteria |
|---|---|
| Session | Call type |
| Session | Connection duration |
Results Columns
| Column |
|---|
| Calling Number (normalized) |
| Called Number (normalized) |
| Release code |
| Releasing party |
| Alerting Duration (secs) |
| Connection Duration (secs) |
| Total Duration (secs) |
| OrigParty Trunk Accounting |
| OrigParty Trunk GroupId |
| OrigParty Trunk Type |
| TermParty Trunk Accounting |
| TermParty Trunk GroupId |
| TermParty Trunk Type |
| Call Type |
| OrigParty Type |
| OrigParty Trunk Id |
| OrigParty Trunk Name |
| OrigParty Call Id |
| OrigParty CallingParty Type |
| OrigParty Privacy |
| Long Call |
| Signaling Media Capability Requested |
| TermParty Type |
| TermParty Trunk Id |
| TermParty Trunk Name |
| TermParty Call Id |
| Correlator |
| Connected |
| Operator |
| Test call |
| Carrier Network Id |
| Carrier Id |
| Carrier Operator Involved |
| Carrier Selection Method |
| Error |
| Releasing Party |
| Routing Requested Address |
| Routing Requested Address Type |
| Routing Calling Orig Address |
| Routing Calling Orig Address Type |
| Routing Destination Address Type |
| Routing Routed Address |
| Routing Routed Address Type |
| Routing CallingParty Routed Address |
| Routing CallingParty Routed Address Type |
| Redirect Count |
| Redirect Reason |
| P-Charging-Vector ICID |
| P-Charging-Vector Orig IOI |
| P-Charging-Vector Term IOI |
REST API
Search Criteria
INFO
This plugin does not support specific search results columns except the standard ones.
Search Results Fields
All the fields available for the GUI search results columns are present in REST API responses.
Exportable CDR Fields
| Tab | Field |
|---|---|
| Session | Connect Time (YYYY-MM-DD HH:MM:SS) |
| Session | Disconnect time (YYYY-MM-DD HH:MM:SS) |
| Session | Release reason |
| Session | Calling Party Number |
| Session | Calling Party Number (normalized) |
| Session | Called Party Number |
| Session | Called Party Number (normalized) |
Exportable Statistics
| Tab | Field |
|---|---|
| Sessions | Ingress calls setup count |
| Sessions | Egress calls setup count |
| Sessions | Total calls setup count |
| Sessions | Ingress calls setup & answered count |
| Sessions | Egress calls setup & answered count |
| Sessions | Total calls setup & answered count |
| Sessions | Ingress calls disconnect count |
| Sessions | Egress calls disconnect count |
| Sessions | Total calls disconnect count |
| Sessions | Ingress call rate (calls/min) |
| Sessions | Egress call rate (calls/min) |
| Sessions | Total call rate (calls/min) |
| Sessions | Ingress calls ringing duration (secs) |
| Sessions | Egress calls ringing duration (secs) |
| Sessions | Ingress calls connection duration (secs) |
| Sessions | Egress calls connection duration (secs) |
Anomalies
| Test |
|---|
| ingress calls setup count |
| egress calls setup count |
| ingress calls setup & answered count |
| egress calls setup & answered count |
| ingress calls disconnect count |
| egress calls disconnect count |
| ingress call rate |
| egress call rate |
| ingress calls ringing duration |
| egress calls ringing duration |
| ingress calls connection duration |
| egress calls connection duration |
Custom Metrics Exposed Fields
| Field | Type |
|---|---|
| CALLTYPE | string |
| INTERNALINDEX | integer |
| POSTDIALDELAY | integer |
| ICSEIZETIME | integer |
| MESSAGEBILLINGINDEX | integer |
| INTELLIGENTNETWORKINFO_SERVICELOGICID | integer |
| INTELLIGENTNETWORKINFO_BCSM | string |
| INTELLIGENTNETWORKINFO_CHARGEADDR | string |
| INTELLIGENTNETWORKINFO_CHARGEADDR_CALLINGPARTYSCREENING | string |
| INTELLIGENTNETWORKINFO_CHARGEADDR_TYPE | string |
| ORIGPARTY_SUBSCRIBERADDR | string |
| ORIGPARTY_SUBSCRIBERADDR_CALLINGPARTYSCREENING | string |
| ORIGPARTY_SUBSCRIBERADDR_TYPE | string |
| ORIGPARTY_FROM | string |
| ORIGPARTY_PACCESSNETWORKINFO | string |
| ORIGPARTY_SERVEDPARTY_SUBSCRIBERADDR | string |
| ORIGPARTY_SERVEDPARTY_SUBSCRIBERADDR_CALLINGPARTYSCREENING | string |
| ORIGPARTY_SERVEDPARTY_SUBSCRIBERADDR_TYPE | string |
| ORIGPARTY_SERVEDPARTY_FROM | string |
| ORIGPARTY_SERVEDPARTY_PACCESSNETWORKINFO | string |
| ORIGPARTY_SERVEDPARTY_TO | string |
| ORIGPARTY_SERVEDPARTY_SIGNALINGTYPE_VARIANT | string |
| ORIGPARTY_SERVEDPARTY_SIGNALINGTYPE | string |
| ORIGPARTY_SERVEDPARTY_ANI-II | string |
| ORIGPARTY_SERVEDPARTY_SIPCALLID | string |
| ORIGPARTY_SERVEDPARTY_TRUNKGROUP_ORIGTRUNKCONTEXT | string |
| ORIGPARTY_SERVEDPARTY_TRUNKGROUP_TRUNKMEMBERID | integer |
| ORIGPARTY_SERVEDPARTY_TRUNKGROUP_DESTTRUNKGROUPLABEL | string |
| ORIGPARTY_SERVEDPARTY_TRUNKGROUP_TRUNKNAME | string |
| ORIGPARTY_SERVEDPARTY_TRUNKGROUP_TYPE | string |
| ORIGPARTY_SERVEDPARTY_TRUNKGROUP_TRUNKGROUPID | integer |
| ORIGPARTY_SERVEDPARTY_TRUNKGROUP_ORIGTRUNKGROUPLABEL | string |
| ORIGPARTY_SERVEDPARTY_TRUNKGROUP_DESTTRUNKCONTEXT | string |
| ORIGPARTY_SERVEDPARTY_TRUNKGROUP_TRUNKACCOUNTING | string |
| ORIGPARTY_SERVEDPARTY_TRUNKGROUP_DUP | string |
| ORIGPARTY_SERVEDPARTY_CPC | string |
| ORIGPARTY_SERVEDPARTY_CHARGEADDR | string |
| ORIGPARTY_SERVEDPARTY_CHARGEADDR_CALLINGPARTYSCREENING | string |
| ORIGPARTY_SERVEDPARTY_CHARGEADDR_TYPE | string |
| ORIGPARTY_SERVEDPARTY_REASON | string |
| ORIGPARTY_SERVEDPARTY_USERAGENT | string |
| ORIGPARTY_SERVEDPARTY_SUBSCRIBERGROUP | string |
| ORIGPARTY_SERVEDPARTY_SOURCEADDRESSES_SIGADDRESS | string |
| ORIGPARTY_SERVEDPARTY_SOURCEADDRESSES_MEDIAPORT | integer |
| ORIGPARTY_SERVEDPARTY_SOURCEADDRESSES_MEDIAIPADDR | string |
| ORIGPARTY_SERVEDPARTY_EXTENSION | integer |
| ORIGPARTY_SERVEDPARTY_REMOTEPARTYID | string |
| ORIGPARTY_SERVEDPARTY_CONTACT | string |
| ORIGPARTY_SERVEDPARTY_PASSERTEDIDENTITY | string |
| ORIGPARTY_SERVEDPARTY_CALLINGPARTYADDR | string |
| ORIGPARTY_SERVEDPARTY_CALLINGPARTYADDR_CALLINGPARTYSCREENING | string |
| ORIGPARTY_SERVEDPARTY_CALLINGPARTYADDR_TYPE | string |
| ORIGPARTY_SERVEDPARTY_VIA | string |
| ORIGPARTY_SERVEDPARTY_BILLINGTYPE | string |
| ORIGPARTY_SERVEDPARTY_PRIVACY | string |
| ORIGPARTY_SERVEDPARTY_REQUESTURI | string |
| ORIGPARTY_SERVEDPARTY_DESTADDRESSES_SIGADDRESS | string |
| ORIGPARTY_SERVEDPARTY_DESTADDRESSES_MEDIAPORT | integer |
| ORIGPARTY_SERVEDPARTY_DESTADDRESSES_MEDIAIPADDR | string |
| ORIGPARTY_SERVEDPARTY_TYPE | string |
| ORIGPARTY_SERVEDPARTY_VQM_ENDPOINT_CALLQUALITY_OVERALLRFACTOR | integer |
| ORIGPARTY_SERVEDPARTY_VQM_ENDPOINT_CALLQUALITY_RFACTOR | integer |
| ORIGPARTY_SERVEDPARTY_VQM_ENDPOINT_CALLQUALITY_LQMOS | integer |
| ORIGPARTY_SERVEDPARTY_VQM_ENDPOINT_CALLQUALITY_CQMOS | integer |
| ORIGPARTY_SERVEDPARTY_VQM_ENDPOINT_CALLQUALITY_EXTERNALRFACTOR | integer |
| ORIGPARTY_SERVEDPARTY_VQM_ENDPOINT_DELAY_ENDSYSTEMDELAY | string |
| ORIGPARTY_SERVEDPARTY_VQM_ENDPOINT_PACKETS_DISCARDED | integer |
| ORIGPARTY_SERVEDPARTY_VQM_ENDPOINT_PACKETS_RECEIVED | integer |
| ORIGPARTY_SERVEDPARTY_VQM_ENDPOINT_PACKETS_SENT | integer |
| ORIGPARTY_SERVEDPARTY_VQM_ENDPOINT_PACKETS_LOSSRATE | integer |
| ORIGPARTY_SERVEDPARTY_VQM_ENDPOINT_JITTER | string |
| ORIGPARTY_SERVEDPARTY_VQM_ENDPOINT_OCTETS_RECEIVED | integer |
| ORIGPARTY_SERVEDPARTY_VQM_ENDPOINT_OCTETS_SENT | integer |
| ORIGPARTY_SERVEDPARTY_VQM_DETECTEDFAXTONE | string |
| ORIGPARTY_SERVEDPARTY_VQM_CODEC | string |
| ORIGPARTY_SERVEDPARTY_VQM_ROUNDTRIPDELAY | string |
| ORIGPARTY_SERVEDPARTY_VQM_TAG_CALLQUALITY_OVERALLRFACTOR | integer |
| ORIGPARTY_SERVEDPARTY_VQM_TAG_CALLQUALITY_RFACTOR | integer |
| ORIGPARTY_SERVEDPARTY_VQM_TAG_CALLQUALITY_LQMOS | integer |
| ORIGPARTY_SERVEDPARTY_VQM_TAG_CALLQUALITY_CQMOS | integer |
| ORIGPARTY_SERVEDPARTY_VQM_TAG_CALLQUALITY_EXTERNALRFACTOR | integer |
| ORIGPARTY_SERVEDPARTY_VQM_TAG_DELAY_ENDSYSTEMDELAY | string |
| ORIGPARTY_SERVEDPARTY_VQM_TAG_PACKETS_DISCARDED | integer |
| ORIGPARTY_SERVEDPARTY_VQM_TAG_PACKETS_RECEIVED | integer |
| ORIGPARTY_SERVEDPARTY_VQM_TAG_PACKETS_SENT | integer |
| ORIGPARTY_SERVEDPARTY_VQM_TAG_PACKETS_LOSSRATE | integer |
| ORIGPARTY_SERVEDPARTY_VQM_TAG_JITTER | string |
| ORIGPARTY_SERVEDPARTY_VQM_TAG_OCTETS_RECEIVED | integer |
| ORIGPARTY_SERVEDPARTY_VQM_TAG_OCTETS_SENT | integer |
| ORIGPARTY_SERVEDPARTY_VQM_CODECS_CODEC | string |
| ORIGPARTY_SERVEDPARTY_BUSINESSGROUPNAME | string |
| ORIGPARTY_SERVEDPARTY_GATEWAY | string |
| ORIGPARTY_TO | string |
| ORIGPARTY_SIGNALINGTYPE_VARIANT | string |
| ORIGPARTY_SIGNALINGTYPE | string |
| ORIGPARTY_ANI-II | string |
| ORIGPARTY_TRUNKGROUP_ORIGTRUNKCONTEXT | string |
| ORIGPARTY_TRUNKGROUP_TRUNKMEMBERID | integer |
| ORIGPARTY_TRUNKGROUP_DESTTRUNKGROUPLABEL | string |
| ORIGPARTY_TRUNKGROUP_TRUNKNAME | string |
| ORIGPARTY_TRUNKGROUP_TYPE | string |
| ORIGPARTY_TRUNKGROUP_TRUNKGROUPID | integer |
| ORIGPARTY_TRUNKGROUP_ORIGTRUNKGROUPLABEL | string |
| ORIGPARTY_TRUNKGROUP_DESTTRUNKCONTEXT | string |
| ORIGPARTY_TRUNKGROUP_TRUNKACCOUNTING | string |
| ORIGPARTY_TRUNKGROUP_DUP | string |
| ORIGPARTY_CPC | string |
| ORIGPARTY_CHARGEADDR | string |
| ORIGPARTY_CHARGEADDR_CALLINGPARTYSCREENING | string |
| ORIGPARTY_CHARGEADDR_TYPE | string |
| ORIGPARTY_REASON | string |
| ORIGPARTY_USERAGENT | string |
| ORIGPARTY_SUBSCRIBERGROUP | string |
| ORIGPARTY_SOURCEADDRESSES_SIGADDRESS | string |
| ORIGPARTY_SOURCEADDRESSES_MEDIAPORT | integer |
| ORIGPARTY_SOURCEADDRESSES_MEDIAIPADDR | string |
| ORIGPARTY_SIPCALLID | string |
| ORIGPARTY_REMOTEPARTYID | string |
| ORIGPARTY_CONTACT | string |
| ORIGPARTY_APPSERVERADDR | string |
| ORIGPARTY_APPSERVERADDR_CALLINGPARTYSCREENING | string |
| ORIGPARTY_APPSERVERADDR_TYPE | string |
| ORIGPARTY_PASSERTEDIDENTITY | string |
| ORIGPARTY_CALLINGPARTYADDR | string |
| ORIGPARTY_CALLINGPARTYADDR_CALLINGPARTYSCREENING | string |
| ORIGPARTY_CALLINGPARTYADDR_TYPE | string |
| ORIGPARTY_VIA | string |
| ORIGPARTY_BILLINGTYPE | string |
| ORIGPARTY_PRIVACY | string |
| ORIGPARTY_REQUESTURI | string |
| ORIGPARTY_DESTADDRESSES_SIGADDRESS | string |
| ORIGPARTY_DESTADDRESSES_MEDIAPORT | integer |
| ORIGPARTY_DESTADDRESSES_MEDIAIPADDR | string |
| ORIGPARTY_TYPE | string |
| ORIGPARTY_VQM_ENDPOINT_CALLQUALITY_OVERALLRFACTOR | integer |
| ORIGPARTY_VQM_ENDPOINT_CALLQUALITY_RFACTOR | integer |
| ORIGPARTY_VQM_ENDPOINT_CALLQUALITY_LQMOS | integer |
| ORIGPARTY_VQM_ENDPOINT_CALLQUALITY_CQMOS | integer |
| ORIGPARTY_VQM_ENDPOINT_CALLQUALITY_EXTERNALRFACTOR | integer |
| ORIGPARTY_VQM_ENDPOINT_DELAY_ENDSYSTEMDELAY | string |
| ORIGPARTY_VQM_ENDPOINT_PACKETS_DISCARDED | integer |
| ORIGPARTY_VQM_ENDPOINT_PACKETS_RECEIVED | integer |
| ORIGPARTY_VQM_ENDPOINT_PACKETS_SENT | integer |
| ORIGPARTY_VQM_ENDPOINT_PACKETS_LOSSRATE | integer |
| ORIGPARTY_VQM_ENDPOINT_JITTER | string |
| ORIGPARTY_VQM_ENDPOINT_OCTETS_RECEIVED | integer |
| ORIGPARTY_VQM_ENDPOINT_OCTETS_SENT | integer |
| ORIGPARTY_VQM_DETECTEDFAXTONE | string |
| ORIGPARTY_VQM_CODEC | string |
| ORIGPARTY_VQM_ROUNDTRIPDELAY | string |
| ORIGPARTY_VQM_TAG_CALLQUALITY_OVERALLRFACTOR | integer |
| ORIGPARTY_VQM_TAG_CALLQUALITY_RFACTOR | integer |
| ORIGPARTY_VQM_TAG_CALLQUALITY_LQMOS | integer |
| ORIGPARTY_VQM_TAG_CALLQUALITY_CQMOS | integer |
| ORIGPARTY_VQM_TAG_CALLQUALITY_EXTERNALRFACTOR | integer |
| ORIGPARTY_VQM_TAG_DELAY_ENDSYSTEMDELAY | string |
| ORIGPARTY_VQM_TAG_PACKETS_DISCARDED | integer |
| ORIGPARTY_VQM_TAG_PACKETS_RECEIVED | integer |
| ORIGPARTY_VQM_TAG_PACKETS_SENT | integer |
| ORIGPARTY_VQM_TAG_PACKETS_LOSSRATE | integer |
| ORIGPARTY_VQM_TAG_JITTER | string |
| ORIGPARTY_VQM_TAG_OCTETS_RECEIVED | integer |
| ORIGPARTY_VQM_TAG_OCTETS_SENT | integer |
| ORIGPARTY_VQM_CODECS_CODEC | string |
| ORIGPARTY_BUSINESSGROUPNAME | string |
| ORIGPARTY_GATEWAY | string |
| DISCONNECTTIME | integer |
| NPINFO_NPSOURCE | string |
| NPINFO_NPROUTINGNUMBER | string |
| NPINFO_NPROUTINGNUMBER_TYPE | string |
| NPINFO_PARTYIDENTIFIER | string |
| RELEASETIME | integer |
| CONNECTTIME | integer |
| LONGCALL | string |
| SIGNALINGINFO_CALLEDPARTYNUMCAT_RECV | string |
| SIGNALINGINFO_CALLEDPARTYNUMCAT_SENT | string |
| SIGNALINGINFO_ANNOUNCEMENT_GROUP | integer |
| SIGNALINGINFO_ANNOUNCEMENT_ID | integer |
| SIGNALINGINFO_MEDIACAPABILITYREQUESTED | string |
| SIGNALINGINFO_PCHARGINGFUNCTIONADDRESSES_CCFADDRESSES | string |
| SIGNALINGINFO_PCHARGINGFUNCTIONADDRESSES_ECFADDRESSES | string |
| SIGNALINGINFO_ISUPUSED | string |
| SIGNALINGINFO_BEARERCAPABILITY | string |
| SIGNALINGINFO_ISUPPREFERENCE | integer |
| SIGNALINGINFO_FALLBACKUSERSERVICE_INFORMATIONTRANSFERCAPABILITY | string |
| SIGNALINGINFO_FALLBACKUSERSERVICE_INFORMATIONTRANSFERCAPABILITY_TYPE | string |
| SIGNALINGINFO_UUIMESSAGES_UUI1_BACKWARDS | integer |
| SIGNALINGINFO_UUIMESSAGES_UUI1_FORWARDS | integer |
| SIGNALINGINFO_UUIMESSAGES_UUI3_BACKWARDS | integer |
| SIGNALINGINFO_UUIMESSAGES_UUI3_FORWARDS | integer |
| SIGNALINGINFO_UUIMESSAGES_UUI2_BACKWARDS | integer |
| SIGNALINGINFO_UUIMESSAGES_UUI2_FORWARDS | integer |
| SIGNALINGINFO_MEDIACAPABILITYUSED | string |
| SIGNALINGINFO_PEER_TYPE | string |
| SIGNALINGINFO_PEER | string |
| SIGNALINGINFO_PEER_ROLE | string |
| SIGNALINGINFO_CALLREFERENCE_POINTCODE | string |
| SIGNALINGINFO_CALLREFERENCE_CALLIDENTITY | integer |
| SIGNALINGINFO_SATELLITEINDICATOR_RECV | integer |
| SIGNALINGINFO_SATELLITEINDICATOR_SENT | integer |
| SIGNALINGINFO_PVISITEDNETWORKID | string |
| SIGNALINGINFO_USERSERVICE_INFORMATIONTRANSFERCAPABILITY | integer |
| SIGNALINGINFO_USERSERVICE_INFORMATIONTRANSFERCAPABILITY_TYPE | integer |
| SIGNALINGINFO_CHARGEINDICATOR | string |
| SIGNALINGINFO_ECHOCONTROLINFO_RECV | string |
| SIGNALINGINFO_ECHOCONTROLINFO_SENT | string |
| SIGNALINGINFO_PCHARGINGVECTOR_ICIDGENERATEDAT | string |
| SIGNALINGINFO_PCHARGINGVECTOR_ORIGIOI | string |
| SIGNALINGINFO_PCHARGINGVECTOR_TERMIOI | string |
| SIGNALINGINFO_PCHARGINGVECTOR_ICIDVALUE | string |
| SIGNALINGINFO_DESTINATIONPOINTCODE | string |
| PGRD | integer |
| TERMPARTY_SUBSCRIBERADDR | string |
| TERMPARTY_SUBSCRIBERADDR_CALLINGPARTYSCREENING | string |
| TERMPARTY_SUBSCRIBERADDR_TYPE | string |
| TERMPARTY_FROM | string |
| TERMPARTY_PACCESSNETWORKINFO | string |
| TERMPARTY_SERVEDPARTY_SUBSCRIBERADDR | string |
| TERMPARTY_SERVEDPARTY_SUBSCRIBERADDR_CALLINGPARTYSCREENING | string |
| TERMPARTY_SERVEDPARTY_SUBSCRIBERADDR_TYPE | string |
| TERMPARTY_SERVEDPARTY_FROM | string |
| TERMPARTY_SERVEDPARTY_PACCESSNETWORKINFO | string |
| TERMPARTY_SERVEDPARTY_TO | string |
| TERMPARTY_SERVEDPARTY_SIGNALINGTYPE_VARIANT | string |
| TERMPARTY_SERVEDPARTY_SIGNALINGTYPE | string |
| TERMPARTY_SERVEDPARTY_ANI-II | string |
| TERMPARTY_SERVEDPARTY_SIPCALLID | string |
| TERMPARTY_SERVEDPARTY_TRUNKGROUP_ORIGTRUNKCONTEXT | string |
| TERMPARTY_SERVEDPARTY_TRUNKGROUP_TRUNKMEMBERID | integer |
| TERMPARTY_SERVEDPARTY_TRUNKGROUP_DESTTRUNKGROUPLABEL | string |
| TERMPARTY_SERVEDPARTY_TRUNKGROUP_TRUNKNAME | string |
| TERMPARTY_SERVEDPARTY_TRUNKGROUP_TYPE | string |
| TERMPARTY_SERVEDPARTY_TRUNKGROUP_TRUNKGROUPID | integer |
| TERMPARTY_SERVEDPARTY_TRUNKGROUP_ORIGTRUNKGROUPLABEL | string |
| TERMPARTY_SERVEDPARTY_TRUNKGROUP_DESTTRUNKCONTEXT | string |
| TERMPARTY_SERVEDPARTY_TRUNKGROUP_TRUNKACCOUNTING | string |
| TERMPARTY_SERVEDPARTY_TRUNKGROUP_DUP | string |
| TERMPARTY_SERVEDPARTY_CPC | string |
| TERMPARTY_SERVEDPARTY_CHARGEADDR | string |
| TERMPARTY_SERVEDPARTY_CHARGEADDR_CALLINGPARTYSCREENING | string |
| TERMPARTY_SERVEDPARTY_CHARGEADDR_TYPE | string |
| TERMPARTY_SERVEDPARTY_REASON | string |
| TERMPARTY_SERVEDPARTY_REASON_TYPE | string |
| TERMPARTY_SERVEDPARTY_USERAGENT | string |
| TERMPARTY_SERVEDPARTY_SUBSCRIBERGROUP | string |
| TERMPARTY_SERVEDPARTY_SOURCEADDRESSES_SIGADDRESS | string |
| TERMPARTY_SERVEDPARTY_SOURCEADDRESSES_MEDIAPORT | integer |
| TERMPARTY_SERVEDPARTY_SOURCEADDRESSES_MEDIAIPADDR | string |
| TERMPARTY_SERVEDPARTY_EXTENSION | integer |
| TERMPARTY_SERVEDPARTY_REMOTEPARTYID | string |
| TERMPARTY_SERVEDPARTY_CONTACT | string |
| TERMPARTY_SERVEDPARTY_PASSERTEDIDENTITY | string |
| TERMPARTY_SERVEDPARTY_CALLINGPARTYADDR | string |
| TERMPARTY_SERVEDPARTY_CALLINGPARTYADDR_CALLINGPARTYSCREENING | string |
| TERMPARTY_SERVEDPARTY_CALLINGPARTYADDR_TYPE | string |
| TERMPARTY_SERVEDPARTY_VIA | string |
| TERMPARTY_SERVEDPARTY_BILLINGTYPE | string |
| TERMPARTY_SERVEDPARTY_PRIVACY | string |
| TERMPARTY_SERVEDPARTY_REQUESTURI | string |
| TERMPARTY_SERVEDPARTY_DESTADDRESSES_SIGADDRESS | string |
| TERMPARTY_SERVEDPARTY_DESTADDRESSES_MEDIAPORT | integer |
| TERMPARTY_SERVEDPARTY_DESTADDRESSES_MEDIAIPADDR | string |
| TERMPARTY_SERVEDPARTY_TYPE | string |
| TERMPARTY_SERVEDPARTY_VQM_ENDPOINT_CALLQUALITY_OVERALLRFACTOR | integer |
| TERMPARTY_SERVEDPARTY_VQM_ENDPOINT_CALLQUALITY_RFACTOR | integer |
| TERMPARTY_SERVEDPARTY_VQM_ENDPOINT_CALLQUALITY_LQMOS | integer |
| TERMPARTY_SERVEDPARTY_VQM_ENDPOINT_CALLQUALITY_CQMOS | integer |
| TERMPARTY_SERVEDPARTY_VQM_ENDPOINT_CALLQUALITY_EXTERNALRFACTOR | integer |
| TERMPARTY_SERVEDPARTY_VQM_ENDPOINT_DELAY_ENDSYSTEMDELAY | string |
| TERMPARTY_SERVEDPARTY_VQM_ENDPOINT_PACKETS_DISCARDED | integer |
| TERMPARTY_SERVEDPARTY_VQM_ENDPOINT_PACKETS_RECEIVED | integer |
| TERMPARTY_SERVEDPARTY_VQM_ENDPOINT_PACKETS_SENT | integer |
| TERMPARTY_SERVEDPARTY_VQM_ENDPOINT_PACKETS_LOSSRATE | integer |
| TERMPARTY_SERVEDPARTY_VQM_ENDPOINT_JITTER | string |
| TERMPARTY_SERVEDPARTY_VQM_ENDPOINT_OCTETS_RECEIVED | integer |
| TERMPARTY_SERVEDPARTY_VQM_ENDPOINT_OCTETS_SENT | integer |
| TERMPARTY_SERVEDPARTY_VQM_DETECTEDFAXTONE | string |
| TERMPARTY_SERVEDPARTY_VQM_CODEC | string |
| TERMPARTY_SERVEDPARTY_VQM_ROUNDTRIPDELAY | string |
| TERMPARTY_SERVEDPARTY_VQM_TAG_CALLQUALITY_OVERALLRFACTOR | integer |
| TERMPARTY_SERVEDPARTY_VQM_TAG_CALLQUALITY_RFACTOR | integer |
| TERMPARTY_SERVEDPARTY_VQM_TAG_CALLQUALITY_LQMOS | integer |
| TERMPARTY_SERVEDPARTY_VQM_TAG_CALLQUALITY_CQMOS | integer |
| TERMPARTY_SERVEDPARTY_VQM_TAG_CALLQUALITY_EXTERNALRFACTOR | integer |
| TERMPARTY_SERVEDPARTY_VQM_TAG_DELAY_ENDSYSTEMDELAY | string |
| TERMPARTY_SERVEDPARTY_VQM_TAG_PACKETS_DISCARDED | integer |
| TERMPARTY_SERVEDPARTY_VQM_TAG_PACKETS_RECEIVED | integer |
| TERMPARTY_SERVEDPARTY_VQM_TAG_PACKETS_SENT | integer |
| TERMPARTY_SERVEDPARTY_VQM_TAG_PACKETS_LOSSRATE | integer |
| TERMPARTY_SERVEDPARTY_VQM_TAG_JITTER | string |
| TERMPARTY_SERVEDPARTY_VQM_TAG_OCTETS_RECEIVED | integer |
| TERMPARTY_SERVEDPARTY_VQM_TAG_OCTETS_SENT | integer |
| TERMPARTY_SERVEDPARTY_VQM_CODECS_CODEC | string |
| TERMPARTY_SERVEDPARTY_BUSINESSGROUPNAME | string |
| TERMPARTY_SERVEDPARTY_GATEWAY | string |
| TERMPARTY_TO | string |
| TERMPARTY_SIGNALINGTYPE_VARIANT | string |
| TERMPARTY_SIGNALINGTYPE | string |
| TERMPARTY_ANI-II | string |
| TERMPARTY_TRUNKGROUP_ORIGTRUNKCONTEXT | string |
| TERMPARTY_TRUNKGROUP_TRUNKMEMBERID | integer |
| TERMPARTY_TRUNKGROUP_DESTTRUNKGROUPLABEL | string |
| TERMPARTY_TRUNKGROUP_TRUNKNAME | string |
| TERMPARTY_TRUNKGROUP_TYPE | string |
| TERMPARTY_TRUNKGROUP_TRUNKGROUPID | integer |
| TERMPARTY_TRUNKGROUP_ORIGTRUNKGROUPLABEL | string |
| TERMPARTY_TRUNKGROUP_DESTTRUNKCONTEXT | string |
| TERMPARTY_TRUNKGROUP_TRUNKACCOUNTING | string |
| TERMPARTY_TRUNKGROUP_DUP | string |
| TERMPARTY_CPC | string |
| TERMPARTY_CHARGEADDR | string |
| TERMPARTY_CHARGEADDR_CALLINGPARTYSCREENING | string |
| TERMPARTY_CHARGEADDR_TYPE | string |
| TERMPARTY_REASON | string |
| TERMPARTY_REASON_TYPE | string |
| TERMPARTY_USERAGENT | string |
| TERMPARTY_SUBSCRIBERGROUP | string |
| TERMPARTY_SOURCEADDRESSES_SIGADDRESS | string |
| TERMPARTY_SOURCEADDRESSES_MEDIAPORT | integer |
| TERMPARTY_SOURCEADDRESSES_MEDIAIPADDR | string |
| TERMPARTY_SIPCALLID | string |
| TERMPARTY_REMOTEPARTYID | string |
| TERMPARTY_CONTACT | string |
| TERMPARTY_APPSERVERADDR | string |
| TERMPARTY_APPSERVERADDR_CALLINGPARTYSCREENING | string |
| TERMPARTY_APPSERVERADDR_TYPE | string |
| TERMPARTY_PASSERTEDIDENTITY | string |
| TERMPARTY_CALLINGPARTYADDR | string |
| TERMPARTY_CALLINGPARTYADDR_CALLINGPARTYSCREENING | string |
| TERMPARTY_CALLINGPARTYADDR_TYPE | string |
| TERMPARTY_VIA | string |
| TERMPARTY_BILLINGTYPE | string |
| TERMPARTY_PRIVACY | string |
| TERMPARTY_REQUESTURI | string |
| TERMPARTY_DESTADDRESSES_SIGADDRESS | string |
| TERMPARTY_DESTADDRESSES_MEDIAPORT | integer |
| TERMPARTY_DESTADDRESSES_MEDIAIPADDR | string |
| TERMPARTY_TYPE | string |
| TERMPARTY_VQM_ENDPOINT_CALLQUALITY_OVERALLRFACTOR | integer |
| TERMPARTY_VQM_ENDPOINT_CALLQUALITY_RFACTOR | integer |
| TERMPARTY_VQM_ENDPOINT_CALLQUALITY_LQMOS | integer |
| TERMPARTY_VQM_ENDPOINT_CALLQUALITY_CQMOS | integer |
| TERMPARTY_VQM_ENDPOINT_CALLQUALITY_EXTERNALRFACTOR | integer |
| TERMPARTY_VQM_ENDPOINT_DELAY_ENDSYSTEMDELAY | string |
| TERMPARTY_VQM_ENDPOINT_PACKETS_DISCARDED | integer |
| TERMPARTY_VQM_ENDPOINT_PACKETS_RECEIVED | integer |
| TERMPARTY_VQM_ENDPOINT_PACKETS_SENT | integer |
| TERMPARTY_VQM_ENDPOINT_PACKETS_LOSSRATE | integer |
| TERMPARTY_VQM_ENDPOINT_JITTER | string |
| TERMPARTY_VQM_ENDPOINT_OCTETS_RECEIVED | integer |
| TERMPARTY_VQM_ENDPOINT_OCTETS_SENT | integer |
| TERMPARTY_VQM_DETECTEDFAXTONE | string |
| TERMPARTY_VQM_CODEC | string |
| TERMPARTY_VQM_ROUNDTRIPDELAY | string |
| TERMPARTY_VQM_TAG_CALLQUALITY_OVERALLRFACTOR | integer |
| TERMPARTY_VQM_TAG_CALLQUALITY_RFACTOR | integer |
| TERMPARTY_VQM_TAG_CALLQUALITY_LQMOS | integer |
| TERMPARTY_VQM_TAG_CALLQUALITY_CQMOS | integer |
| TERMPARTY_VQM_TAG_CALLQUALITY_EXTERNALRFACTOR | integer |
| TERMPARTY_VQM_TAG_DELAY_ENDSYSTEMDELAY | string |
| TERMPARTY_VQM_TAG_PACKETS_DISCARDED | integer |
| TERMPARTY_VQM_TAG_PACKETS_RECEIVED | integer |
| TERMPARTY_VQM_TAG_PACKETS_SENT | integer |
| TERMPARTY_VQM_TAG_PACKETS_LOSSRATE | integer |
| TERMPARTY_VQM_TAG_JITTER | string |
| TERMPARTY_VQM_TAG_OCTETS_RECEIVED | integer |
| TERMPARTY_VQM_TAG_OCTETS_SENT | integer |
| TERMPARTY_VQM_CODECS_CODEC | string |
| TERMPARTY_BUSINESSGROUPNAME | string |
| TERMPARTY_GATEWAY | string |
| RELEASECAUSE | integer |
| CORRELATOR | string |
| CONNECTED | string |
| OGSEIZETIME | integer |
| OPERATOR | string |
| OUTGOINGGATEWAY | string |
| CLASS | integer |
| FEATURES_FEATURE | string |
| CALLFORWARDINFO_LASTREDIRECTINGADDR | string |
| CALLFORWARDINFO_LASTREDIRECTINGADDR_CALLINGPARTYSCREENING | string |
| CALLFORWARDINFO_LASTREDIRECTINGADDR_TYPE | string |
| CALLFORWARDINFO_PRIVACY | string |
| CALLFORWARDINFO_ORIGINALCALLEDADDR | string |
| CALLFORWARDINFO_ORIGINALCALLEDADDR_CALLINGPARTYSCREENING | string |
| CALLFORWARDINFO_ORIGINALCALLEDADDR_TYPE | string |
| CALLFORWARDINFO_ORIGINALREDIRECTREASON | string |
| CALLFORWARDINFO_REDIRECTCOUNT | integer |
| CALLFORWARDINFO_ORIGINALCALLINGADDR | string |
| CALLFORWARDINFO_ORIGINALCALLINGADDR_CALLINGPARTYSCREENING | string |
| CALLFORWARDINFO_ORIGINALCALLINGADDR_TYPE | string |
| CALLFORWARDINFO_REDIRECTREASON | string |
| INCOMINGGATEWAY | string |
| RINGINGTIME | integer |
| TESTCALL | string |
| UDAS_UDA_ID | integer |
| UDAS_UDA | integer |
| SEQNUM | integer |
| CARRIERSELECTINFO_NETWORKID | integer |
| CARRIERSELECTINFO_CARRIERID | integer |
| CARRIERSELECTINFO_CARRIEROPERATORINVOLVED | string |
| CARRIERSELECTINFO_SELECTIONMETHOD | string |
| PGAD | integer |
| SIPIBODYRELEASECAUSE | integer |
| CUSTOMERINFO_SERVICE | integer |
| CUSTOMERINFO | string |
| CUSTOMERINFO_QUALIFIER | integer |
| CUSTOMERINFO_TYPE | string |
| ERROR | string |
| REESTABLISHED | string |
| RELEASINGPARTY | string |
| ROUTINGINFO_REQUESTEDADDR | string |
| ROUTINGINFO_REQUESTEDADDR_CALLINGPARTYSCREENING | string |
| ROUTINGINFO_REQUESTEDADDR_TYPE | string |
| ROUTINGINFO_FAILEDTRUNKGROUPS_FAILEDTRUNKGROUP_TRUNKGROUPID | integer |
| ROUTINGINFO_FAILEDTRUNKGROUPS_FAILEDTRUNKGROUP_REASON | string |
| ROUTINGINFO_FAILEDTRUNKGROUPS_FAILEDTRUNKGROUP_REASON_TYPE | string |
| ROUTINGINFO_FAILEDTRUNKGROUPS_FAILEDTRUNKGROUP_TRUNKACCOUNTING | string |
| ROUTINGINFO_CALLINGPARTYORIGADDR | string |
| ROUTINGINFO_CALLINGPARTYORIGADDR_CALLINGPARTYSCREENING | string |
| ROUTINGINFO_CALLINGPARTYORIGADDR_TYPE | string |
| ROUTINGINFO_DESTADDR | string |
| ROUTINGINFO_DESTADDR_CALLINGPARTYSCREENING | string |
| ROUTINGINFO_DESTADDR_TYPE | string |
| ROUTINGINFO_ROUTEDADDR | string |
| ROUTINGINFO_ROUTEDADDR_CALLINGPARTYSCREENING | string |
| ROUTINGINFO_ROUTEDADDR_TYPE | string |
| ROUTINGINFO_CALLINGPARTYROUTEDADDR | string |
| ROUTINGINFO_CALLINGPARTYROUTEDADDR_CALLINGPARTYSCREENING | string |
| ROUTINGINFO_CALLINGPARTYROUTEDADDR_TYPE | string |
| RELEASEREASON | string |
| LONGDURATIONINFO_COUNT | integer |
| LONGDURATIONINFO_PREVIOUSTIME | integer |
| LONGDURATIONINFO_STATUS | string |
| LONGDURATIONINFO_CURRENTTIME | integer |
| COMPLETETIME | integer |
| ACCOUNTCODEINFO | string |
Italtel Softswitch
Plugin name: italtel
Trace correlation support: no
DB collection name: italtelcdrs
Base configuration object: Exchange codes
Sub-groups:
- Trunks
GUI Search Calls
Search Criteria
INFO
This plugin does not support specific search criteria except the standard ones.
Results Columns
| Column |
|---|
| Calling NAI |
| Called NAI |
| Calling Number (normalized) |
| Called Number (normalized) |
| Called (4) |
| Called NAI (4) |
| Routed called (203) |
| Routed called NAI (203) |
| Delivered CLI (50) |
| Delivered CLI NAI (50) |
| Alerting Duration (secs) |
| Connection Duration (secs) |
| Total Duration (secs) |
| Start Time |
| Call Duration (secs) |
| Disconnect Cause (10) |
| Call id |
| Final Status |
| Interactive Phase Duration (secs) |
| Call type |
| Bearer service (6) |
| Source Port (7) |
| Destination Port (7) |
| Source IP (8) |
| Destination IP (8) |
REST API
Search Criteria
INFO
This plugin does not support specific search results columns except the standard ones.
Search Results Fields
All the fields available for the GUI search results columns are present in REST API responses.
Exportable CDR Fields
| Tab | Field |
|---|---|
| Details | Setup Time |
| Details | Connect Time |
| Details | Disconnect Time |
| Details | Release cause |
| Details | Call Id |
| Details | Calling |
| Details | Called |
| Details | Source port |
| Details | Destination port |
| Details | Source IP |
| Details | Destination IP |
Exportable Statistics
| Tab | Field |
|---|---|
| Sessions | Ingress calls setup count |
| Sessions | Egress calls setup count |
| Sessions | Total calls setup count |
| Sessions | Ingress calls setup & answered count |
| Sessions | Egress calls setup & answered count |
| Sessions | Total calls setup & answered count |
| Sessions | Ingress calls disconnect count |
| Sessions | Egress calls disconnect count |
| Sessions | Total calls disconnect count |
| Sessions | Ingress traffic intensity (erlangs) |
| Sessions | Egress traffic intensity (erlangs) |
| Sessions | Total traffic intensity (erlangs) |
| Sessions | Ingress max simultaneous calls (channels) |
| Sessions | Egress max simultaneous calls (channels) |
| Sessions | Total max simultaneous calls (channels) |
| Sessions | Ingress call rate (calls/min) |
| Sessions | Egress call rate (calls/min) |
| Sessions | Total call rate (calls/min) |
| Sessions | Ingress calls average connection duration (secs) |
| Sessions | Egress calls average connection duration (secs) |
| Sessions | Ingress calls total connection duration (secs) |
| Sessions | Egress calls total connection duration (secs) |
Anomalies
| Test |
|---|
| ingress calls setup count |
| egress calls setup count |
| ingress calls setup & answered count |
| egress calls setup & answered count |
| ingress calls disconnect count |
| egress calls disconnect count |
| ingress traffic intensity |
| egress traffic intensity |
| ingress traffic intensity variation (%) |
| egress traffic intensity variation (%) |
| ingress max simultaneous calls |
| egress max simultaneous calls |
| total capacity usage |
| ingress call rate |
| egress call rate |
| ingress calls ringing duration |
| egress calls ringing duration |
| ingress calls connection duration |
| egress calls connection duration |
Custom Metrics Exposed Fields
| Field | Type |
|---|---|
| CDR_EXCHANGE_CODE | string |
| CALL_DURATION | float |
| CALL_TYPE | integer |
| CALL_ID | string |
| CALLING_NAI | integer |
| ROUTED_CALLED | string |
| ROUTED_CALLED_NAI | integer |
| CALLED_NAI | integer |
| DELIVERED_CLI | string |
| DELIVERED_CLI_NAI | integer |
| RELEASE_CAUSE | integer |
| FINAL_STATUS | integer |
| INTERACTIVE_PHASE_DURATION | integer |
| BEARER_SERVICE | integer |
| QOS_SENT_PACKETS | integer |
| QOS_RECEIVED_PACKETS | integer |
| QOS_SENT_BYTES | integer |
| QOS_RECEIVED_BYTES | integer |
Ribbon SBC
Plugin name: sonus
Trace correlation support: yes
DB collection name: sonuscdrs
Base configuration object: Gateways
Sub-groups:
- Trunks
GUI Search Calls
Search Criteria
| Tab | Search Criteria |
|---|---|
| SIP | From Field |
| SIP | To Field |
| SIP | Status Code |
| SIP | Call ID |
| SIP | Transport |
| Record | Record Type |
| Record | Final Attempt Indicator |
| Record | Accounting Id |
| Record | Call Direction |
| Session | Disconnect Reason |
| Session | Disconnect Initiator |
Results Columns
| Column |
|---|
| Record Type |
| Final Attempt Indicator |
| Accounting Id |
| Call Direction |
| Calling Number (normalized) |
| Called Number (normalized) |
| Ingress SIP From Field |
| Egress SIP From Field |
| Ingress SIP To Field |
| Egress SIP To Field |
| Alerting Duration (secs) |
| Connection Duration (secs) |
| Total Duration (secs) |
| Disconnect Reason |
| Disconnect Initiator |
| Service Provider |
| Route Label |
| Route Attempt Number |
| Route Selected |
| Egress Local Gateway Signaling IP Address |
| Egress Remote Gateway Signaling IP Address |
| Ingress PSTN Circuit Endpoint |
| Ingress IP Circuit Endpoint |
| Egress PSTN Circuit Endpoint |
| Egress IP Circuit Endpoint |
| Ingress SIP Call ID |
| Egress SIP Call ID |
| Ingress SIP Status Code |
| Egress SIP Status Code |
| Ingress SIP Transport |
| Egress SIP Transport |
| Ingress Codec Type |
| Egress Codec Type |
| Ingress RTP Packetization Time |
| Egress RTP Packetization Time |
| Calling Ingress RTP Packets |
| Calling Egress RTP Packets |
| Called Ingress RTP Packets |
| Called Egress RTP Packets |
| Calling Ingress RTP Packets Lost |
| Calling Egress RTP Packets Lost |
| Calling RTP Avg Jitter |
| Calling RTCP Avg Latency |
REST API
Search Criteria
INFO
This plugin does not support specific search results columns except the standard ones.
Search Results Fields
All the fields available for the GUI search results columns are present in REST API responses.
Exportable CDR Fields
| Tab | Field |
|---|---|
| Details | record type |
| Details | gateway name |
| Details | accounting id |
| Details | start time in system tick |
| Details | node time zone |
| Details | start date |
| Details | start time |
| Details | Time Elapsed from Receipt of Setup Message to Policy Server Sonus SoftSwitch Response |
| Details | Time Elapsed from Receipt of Setup Message to Receipt of AlertingProcProg |
| Details | Time Elapsed from Receipt of Setup Message to Service Established |
| Details | Disconnect Date |
| Details | Disconnect Time |
| Details | Time Elapsed from Receipt of Disconnect to Completion of Call |
| Details | Call Service Duration |
| Details | Call Disconnect Reason |
| Details | Service Delivered |
| Details | Call Direction |
| Details | Service Provider |
| Details | Transit Network Selection Code |
| Details | Calling Number |
| Details | Called Number |
| Details | Extra Called Address Digits |
| Details | Number of Called Num Translations Done by This Node |
| Details | Called Number Before Translation 1 |
| Details | Translation Type 1 |
| Details | Called Number Before Translation 2 |
| Details | Translation Type 2 |
| Details | Billing Number |
| Details | Route Label |
| Details | Route Attempt Number |
| Details | Route Selected |
| Details | Egress Local Gateway Signaling IP Address |
| Details | Egress Remote Gateway Signaling IP Address |
| Details | Ingress Trunk Group Name |
| Details | Ingress PSTN Circuit End Point |
| Details | Ingress IP Circuit End Point |
| Details | Egress PSTN Circuit End Point |
| Details | Egress IP Circuit End Point |
| Details | Ingress Number of Audio Bytes Sent |
| Details | Ingress Number of Audio Packets Sent |
| Details | Ingress Number of Audio Bytes Received |
| Details | Ingress Number of Audio Packets Received |
| Details | Originating Line Information OLIP |
| Details | Jurisdiction Information Parameter |
| Details | Carrier Code |
| Details | Call Group ID |
| Details | Script Log Data |
| Details | Time Elapsed from Receipt of Setup Message to Receipt of Exit Message |
| Details | Time Elapsed from Receipt of Setup Message to Generation of Exit Message |
| Details | Calling Party Nature of Address Field |
| Details | Called Party Nature of Address |
| Details | Ingress Protocol Variant Specific Data |
| Details | Ingress Signaling Type |
| Details | Egress Signaling Type |
| Details | Ingress Far End Switch Type |
| Details | Egress Far End Switch Type |
| Details | Carrier Code of the Carrier That Owns the Far End of the Ingress Trunk Group |
| Details | Carrier Code of the Carrier That Owns the Far End of the Egress Trunk Group |
| Details | Calling Party Category |
| Details | Dialed Number |
| Details | Carrier Selection Information |
| Details | Called Number Numbering Plan |
| Details | Generic Address Parameter |
| Details | Disconnect Initiator |
| Details | Ingress Number of Packets Recorded as Lost |
| Details | Ingress Interarrival Packet Jitter |
| Details | Ingress Last Measurement for Latency |
| Details | Egress Trunk Group Name |
| Details | Egress Protocol Variant Specific Data |
| Details | Incoming Calling Number |
| Details | AMA Call Type |
| Details | Message Billing Index MBI |
| Details | Originating LATA |
| Details | Route Index Used |
| Details | Calling Party Number Presentation Restriction |
| Details | Incoming ISUP Charge Number |
| Details | Incoming ISUP Charge Number NOA |
| Details | Dialed Number NOA |
| Details | Ingress Codec Type |
| Details | Egress Codec Type |
| Details | Ingress RTP Packetization Time |
| Details | GSX Call ID |
| Details | Originator Echo Cancellation |
| Details | Terminator Echo Cancellation |
| Details | Charge Flag |
| Details | AMA Service Logic Identification |
| Details | AMA BAF Module |
| Details | AMA Set Hex AB Indication |
| Details | Service Feature ID |
| Details | FE Parameter |
| Details | Satellite Indicator |
| Details | PSX Billing Information |
| Details | Originating TDM Trunk Group Type |
| Details | Terminating TDM Trunk Group Type |
| Details | Ingress Trunk Member Number |
| Details | Egress Trunk Group ID |
| Details | Egress Switch ID |
| Details | Active Call Ingress Local ATM Address |
| Details | Active Call Ingress Remote ATM Address |
| Details | Active Call Egress Local ATM Address |
| Details | Active Call Egress Remote ATM Address |
| Details | Policy Response Call Type |
| Details | Outgoing Route Identification |
| Details | Outgoing Message Identification |
| Details | Incoming Route Identification |
| Details | Calling Name |
| Details | Calling Name Type |
| Details | Incoming Calling Party Numbering Plan |
| Details | Outgoing Calling Party Numbering Plan |
| Details | Calling Party Business Group ID |
| Details | Called Party Business Group ID |
| Details | Calling Party Public Presence Directory Number |
| Details | Elapsed Time from Receipt of Setup Message to Last Call Routing Attempt |
| Details | Billing Number NOA |
| Details | Incoming Calling Number NOA |
| Details | Egress Trunk Member Number |
| Details | Selected Route Type |
| Details | Telcordia Long Duration Record Type |
| Details | Time Elapsed from Previous Record |
| Details | Cumulative Route Index |
| Details | Call Disconnect Reason Transmitted to Ingress |
| Details | Call Disconnect Reason Transmitted to Egress |
| Details | ISDN PRI Calling Party Subaddress |
| Details | Outgoing Trunk Group Number in EXM |
| Details | Ingress Local Gateway Signaling IP Address |
| Details | Ingress Remote Gateway Signaling IP Address |
| Details | Record Sequence Number |
| Details | Transmission Medium Requirement TMR |
| Details | Information Transfer Rate ITR |
| Details | User Service Information USI User Information Layer 1 |
| Details | Unrecognized Raw ISUP Calling Party Category |
| Details | Egress Release Link Trunking RLT Feature Specific Data |
| Details | Two B Channel Transfer Feature Specific Data |
| Details | Calling Party Business Unit |
| Details | Called Party Business Unit |
| Details | Redirect Feature Specific Data |
| Details | Ingress Release Link Trunking RLT Feature Specific Data |
| Details | PSX Index |
| Details | PSX Congestion Level |
| Details | PSX Processing Time |
| Details | Script Name |
| Details | Ingress External Accounting Data |
| Details | Egress External Accounting Data |
| Details | Egress RTP Packetization Time |
| Details | Egress Number of Audio Bytes Sent |
| Details | Egress Number of Audio Packets Sent |
| Details | Egress Number of Audio Bytes Received |
| Details | Egress Number of Audio Packets Received |
| Details | Egress Number of Packets Recorded as Lost |
| Details | Egress Interarrival Packet Jitter |
| Details | Egress Last Measurement for Latency |
| Details | Ingress Maximum Packet Outage |
| Details | Egress Maximum Packet Outage |
| Details | Ingress Packet Playout Buffer Quality |
| Details | Egress Packet Playout Buffer Quality |
| Details | Call Supervision Type |
| Details | Ingress SIP Refer Replaces Feature Specific Data |
| Details | Egress SIP Refer Replaces Feature Specific Data |
| Details | Network Transfer Feature Specific Data |
| Details | Call Condition |
| Details | Toll Indicator |
| Details | Generic Number Number |
| Details | Generic Number Presentation Restriction Indicator |
| Details | Generic Number Numbering Plan |
| Details | Generic Number Nature of Address |
| Details | Generic Number Type |
| Details | Originating Trunk Type |
| Details | Terminating Trunk Type |
| Details | Remote GSX Billing Indicator |
| Details | VPN Calling Private Presence Number |
| Details | VPN Calling Public Presence Number |
| Details | External Furnish Charging Info |
| Details | Ingress Policing Discards |
| Details | Egress Policing Discards |
| Details | Announcement ID |
| Details | Source Information |
| Details | Partition ID |
| Details | Network ID |
| Details | NCOS |
| Details | Ingress SRTP |
| Details | Egress SRTP |
| Details | ISDN Access Indicator from the Forward Call Indicator |
| Details | Call Disconnect Location |
| Details | Call Disconnect Location Transmitted to Ingress |
| Details | Call Disconnect Location Transmitted to Egress |
| Details | Network Call Reference Call Identity |
| Details | Network Call Reference Signaling Point Code |
| Details | Ingress ISUP MIME Protocol Variant Specific Data |
| Details | Egress ISUP MIME Protocol Variant Specific Data |
| Details | Modem Tone Type |
| Details | Modem Tone Signal Level |
| Details | Video Codec Data |
| Details | Video Codec Statistics |
| Details | Customer |
| Details | null field |
| Details | Call to Test PSX |
| Details | PSX Overlap Route Requests |
| Details | Call Setup Delay |
| Details | Overload Status |
| Details | Ingress BICC Info |
| Details | Egress BICC Info |
| Details | Ingress DSP Data |
| Details | Egress DSP Data |
| Details | Call Recorded Indicator |
| Details | Call Recorded RTP Tx IP Address |
| Details | Call Recorded RTP Tx Port Number |
| Details | Call Recorded RTP Rv IP Address |
| Details | Call Recorded RTP Rv Port Number |
| Details | MLPP Precedence Level |
| Details | MSRP Service Type |
| Details | NPUKK Special Routing Information |
| Details | NPUKK Customer Or Carrier Identification |
| Details | NPUKK Service Type Identifier |
| Details | NPSSP Special Handling Information |
| Details | NPSSP Service Type Identifier |
| Details | Total ITX Charge Units |
| Details | Global Charge Reference |
| Details | IP Call Limit at ingress SIP Peer |
| Details | IP Call Limit at ingress IPTG |
| Details | IP BW Limit at ingress IPTG |
| Details | IP Call Limit at egress SIP Peer |
| Details | IP Call Limit at egress IPTG |
| Details | IP BW Limit at egress IPTG |
Exportable Statistics
| Tab | Field |
|---|---|
| Sessions | Ingress calls setup count |
| Sessions | Egress calls setup count |
| Sessions | Total calls setup count |
| Sessions | Ingress calls setup & answered count |
| Sessions | Egress calls setup & answered count |
| Sessions | Total calls setup & answered count |
| Sessions | Ingress calls disconnect count |
| Sessions | Egress calls disconnect count |
| Sessions | Total calls disconnect count |
| Sessions | Ingress traffic intensity (erlangs) |
| Sessions | Egress traffic intensity (erlangs) |
| Sessions | Total traffic intensity (erlangs) |
| Sessions | Ingress max simultaneous calls (channels) |
| Sessions | Egress max simultaneous calls (channels) |
| Sessions | Total max simultaneous calls (channels) |
| Sessions | Ingress call rate (calls/min) |
| Sessions | Egress call rate (calls/min) |
| Sessions | Total call rate (calls/min) |
| Sessions | Ingress calls ringing duration (secs) |
| Sessions | Egress calls ringing duration (secs) |
| Sessions | Ingress calls connection duration (secs) |
| Sessions | Egress calls connection duration (secs) |
Anomalies
| Test |
|---|
| ingress calls setup count |
| egress calls setup count |
| ingress calls setup & answered count |
| egress calls setup & answered count |
| ingress calls disconnect count |
| egress calls disconnect count |
| ingress traffic intensity |
| egress traffic intensity |
| ingress traffic intensity variation (%) |
| egress traffic intensity variation (%) |
| ingress max simultaneous calls |
| egress max simultaneous calls |
| total capacity usage |
| ingress call rate |
| egress call rate |
| ingress calls ringing duration |
| egress calls ringing duration |
| ingress calls connection duration |
| egress calls connection duration |
| ingress media packet latency (RTCP) |
| egress media packet latency (RTCP) |
Custom Metrics Exposed Fields
INFO
This plugin does not support any specific CDR field for custom metrics, except the standard ones.
[^1]: These groups are not the Nemo Groups defined above but Cisco groups, with a different meaning, roughly equivalent to «enterprise(s)».
